Understanding the data analysis domain can be exciting and overwhelming, especially for beginners. In our comprehensive splunk tutorial for beginners, we will guide you through the intriguing world of data exploration.
Throughout this tutorial, we'll unravel the fundamental concepts of Splunk, a robust platform that transforms raw data into actionable insights. We'll begin with the splunk basics, introducing you to the core functionalities and terminology. From there, we'll delve into data ingestion, showing you how to bring various data sources into Splunk for analysis.
What is Splunk?
Splunk is a versatile and powerful data platform that enables organizations to turn raw data into valuable insights. It is widely used for analyzing, monitoring, and visualizing data from different sources to gain actionable intelligence and make informed decisions. With its robust capabilities, Splunk is a go-to tool for IT operations, security, business intelligence, and more.
Examples of Splunk Use Cases:
- IT Operations Monitoring: Organizations use Splunk to monitor their IT infrastructure, servers, networks, and applications. For instance, a company might use Splunk to identify performance bottlenecks in their web servers by analyzing log data.
- Security Information and Event Management (SIEM): Splunk is often used for security analysis. For example, it can identify unusual login patterns that might indicate a cyber attack.
- Business Intelligence: In the business context, Splunk can be used to analyze customer behavior, sales trends, and operational efficiency. Retailers might analyze purchasing patterns to optimize inventory management.
- Internet of Things (IoT) Monitoring: Splunk can collect and analyze data from IoT devices. For instance, a manufacturer could monitor sensor data from machinery to predict maintenance needs and prevent downtime.
- Application Performance Monitoring: Organizations can monitor the performance of their applications, identify errors, and optimize user experiences by analyzing application logs and metrics.
Splunk's flexibility and adaptability make it a valuable asset across various industries and use cases, helping organizations make sense of their data and generate insights that drive better decision-making.
Splunk Versions
Within the dynamic data analytics landscape, Splunk emerges as a versatile and transformative platform catering to a spectrum of organizational needs. Tailoring its offerings to diverse use cases, Splunk provides a range of versions that empower businesses to unravel insights hidden within their data streams. From intricate IT operations to robust security analysis and beyond, each version of Splunk serves as a gateway to informed decision-making.
Let's delve into this tapestry of Splunk versions:
- Splunk Free: Where exploration begins, offering limited yet impactful capabilities, making it the perfect launchpad for small-scale data analysis.
- Splunk Enterprise: The pinnacle of Splunk's prowess, Enterprise is helping enterprises grapple with vast and complex data landscapes. Deployable on-premises or in the cloud, it's a cornerstone of IT operations, security, and beyond.
- Splunk Cloud: Seamlessly merging power and convenience, this version brings Splunk's prowess to the cloud realm, removing the burden of on-premises maintenance.
- Splunk Light: An elegant solution tailored for smaller IT environments, providing essential indexing and search functions.
- Splunk IT Service Intelligence (ITSI): Navigating the intricate world of IT services, this version clarifies service performance and offers insights for effective infrastructure management.
- Splunk Security Solutions: Safeguarding with precision, Splunk's security-focused versions, including Enterprise Security (ES) and User Behavior Analytics (UBA), stand guard against threats and unearth critical patterns.
- Splunk Observability Suite: Ensuring holistic insights, this suite orchestrates Infrastructure Monitoring, APM, and Synthetic Monitoring, delivering end-to-end observability for applications and infrastructure.
- Splunk Industrial Asset Intelligence (IAI): This version empowers organizations to monitor, assess, and optimize industrial systems and machinery.
- Splunk Data Stream Processor (DSP): For real-time analytics, DSP reigns supreme, enabling organizations to harness the potential of streaming data with efficiency.
- Splunk Phantom: A symphony of security orchestration and automation, Phantom streamlines security operations for rapid response.
Features of Splunk
Splunk is renowned for its rich features enabling organizations to analyze and derive insights from their data. Here are some key features of Splunk, along with examples to illustrate how they work:
- Data Collection
Splunk allows you to collect data from various sources, such as logs, metrics, events, and more. This data can come from applications, servers, devices, and external systems.
Example: A web server generates log files containing information about user requests, response times, and errors. Splunk can collect and index these log files for analysis.
- Indexing and Search
Splunk indexes the collected data, making it searchable and retrievable at high speeds. Users can then search, filter, and analyze this indexed data.
Example: An IT team uses Splunk to index and search through server logs to identify the root cause of a performance issue.
- Real-time Analysis
Splunk enables real-time data analysis, allowing users to monitor ongoing events and trends as they happen.
Example: A security team monitors network traffic in real time using Splunk to detect and respond to potential cyber threats.
- Search Processing Language (SPL)
SPL is a powerful query language that allows users to perform complex searches, calculations, and statistical analysis on their data.
Example: A business analyst uses SPL to calculate the average purchase amount per customer and create visualizations to analyze buying patterns.
- Visualizations and Dashboards
Splunk provides tools to create visualizations like charts, graphs, and maps. Dashboards can be built to showcase these visualizations, making it easier to understand and communicate insights.
Example: An operations team creates a dashboard displaying real-time server performance metrics, helping them quickly identify anomalies.
- Alerting and Notifications
Splunk can trigger alerts based on specific conditions or patterns in the data. These alerts can be sent via email, SMS, or integrated with other communication systems.
Example: A system administrator sets up an alert to notify them when server CPU usage exceeds a certain threshold.
- Machine Learning and AI Integration
Splunk integrates machine learning and artificial intelligence capabilities to identify patterns, anomalies, and trends in data.
Example: An e-commerce company uses machine learning in Splunk to predict customer churn based on historical behavior and demographics.
- Data Enrichment and Transformation
Splunk allows you to enrich and transform data during indexing, adding context and making it more valuable for analysis.
Example: An IoT application enriches sensor data with location information to analyze how environmental factors impact machine performance.
- Universal Forwarders
Universal forwarders are lightweight agents that collect and send data to the Splunk indexers.
Example: A mobile app developer uses a forwarder to send user behavior data from the app to Splunk to analyze user interactions.
These features collectively empower organizations to gain insights, improve decision-making, enhance security, and optimize their operations using data-driven approaches.
Lookups in Splunk
In Splunk, "lookups" refer to a powerful feature that allows you to enrich or modify your data by referencing external data sources. Lookups provide a way to combine data from different sources, enhancing the context and value of your analysis.
This feature is handy when you want to associate additional information with your events or perform more complex analysis that requires data correlation.
Here's a breakdown of lookups in Splunk:
- What Are Lookups Used For?
Lookups are used to add fields or values to your events based on matching data in an external table or file. This can be incredibly useful for:
- Enrichment: Adding additional details to your events. For example, mapping IP addresses to geographic locations or correlating user IDs with employee names.
- Data Correlation: Combining data from different sources based on common fields. For instance, associating customer IDs from your logs with customer information from a CRM system.
- Types of Lookups
Splunk supports various types of lookups, including:
- CSV Lookups: These involve referencing data from a CSV (Comma-Separated Values) file that you upload to Splunk. This is a common method for smaller datasets.
- KV Store Lookups: Using Splunk's internal key-value store to perform faster and more scalable lookups.
- External Lookup Scripts: Running custom scripts (Python, Perl, etc.) to perform more complex lookups involving external databases or APIs.
Splunk query language
Splunk Query Language (SPL) is a powerful and flexible language used to search, analyze, and extract insights from your data in Splunk. It enables you to perform a wide range of operations on your data, from simple searches to complex analysis and reporting. SPL is designed to help you explore and transform your data to find patterns, anomalies, trends, and more.
Here's an overview of some key aspects of SPL:
- Basic Structure:
SPL queries are typically composed of commands followed by arguments, field names, and values. Commands are separated by pipe (|) characters to create a pipeline of operations.
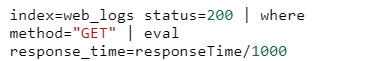
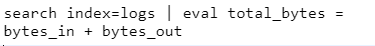
- Searching and Filtering:
You can use commands like search, where, and eval to filter and manipulate your data. For example:
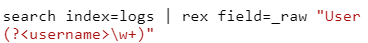
- Field Extraction:
SPL allows you to extract fields from your data using the rex or spath command. This is useful when you want to isolate specific pieces of information within your events.

- Aggregation and Statistics
SPL offers commands like stats, chart, timechart, and top to perform aggregation and generate statistical summaries of your data.

- Time-Based Analysis:
A time-based analysis is crucial in Splunk. You can use time-related commands like timechart to visualize data trends over time.

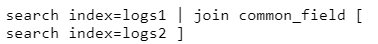
- Joining and Merging Data:
SPL lets you combine data from different sources using commands like join and appendcols.

- Subsearches
You can use subsearches to use the results of one search as input for another.

Splunk Commands
Splunk offers a wide range of commands you can use in the Splunk Query Language (SPL) to search, filter, transform, and analyze your data. These commands are the building blocks for constructing queries and extracting insights from your data. The following are some commonly used Splunk commands, along with brief explanations:
- search: The primary command used to initiate a search. It retrieves events from the specified index or indexes based on your search criteria.

- table: Displays results in a tabular format, showing specific fields from the events.

- stats: Computes statistics, aggregations, and summaries of your data. You can use functions like count, sum, avg, etc.

- timechart: Generates time-based visualizations, such as line charts, bar charts, or area charts, to display data trends over time.

- eval: Creates new fields or modifies existing fields using calculations or transformations.
- where: Filters events based on specified conditions.

- rex: Extracts fields using regular expressions.
- transaction: Groups events together based on a shared field or condition, forming transactions.

- join: Combines events from different sources based on common fields.
Conclusion
In the ever-evolving landscape of data analytics, Splunk stands as a beacon of transformation, empowering organizations to harness the power of their data like never before. With its array of features and capabilities, Splunk has become a cornerstone for diverse industries, paving the way for informed decision-making, enhanced security, and operational excellence.
From the moment data is collected to the creation of insightful visualizations, Splunk orchestrates a seamless journey through the intricacies of data analysis. It transforms raw data into actionable insights, revealing hidden patterns, trends, and anomalies that might otherwise go unnoticed.
As we've explored the key features of Splunk, from its real-time analysis prowess to its ability to turn data into meaningful visual stories, it's evident that Splunk is not just a tool, but a strategic asset for organizations striving to thrive in a data-driven world.
FAQs
1. How does Splunk handle data security and privacy?
Splunk prioritizes data security and privacy with encryption, role-based access control, and data masking. It ensures secure token authentication and integrates with authentication providers like LDAP and SAML. How can Splunk be used for business intelligence and reporting?
2. How can Splunk be used for business intelligence and reporting?
Splunk extends beyond IT to drive business insights. It analyzes sales, customer interactions, etc., offering visualization tools and dashboards for creating informative reports. How can machine learning be integrated into Splunk for advanced analysis?
3. How can machine learning be integrated into Splunk for advanced analysis?
Splunk's Machine Learning Toolkit (MLTK) enables predictive analysis and anomaly detection. Users can build custom models, detect patterns, and predict outcomes without extensive data science expertise.


-d9bdeff6165f4eb1ba2adcebde78e961.svg)


-ae8d039bbd2a41318308f8d26b52ac8f.svg)
-35c169da468a4cc481c6a8505a74826d.webp&w=128&q=75)
-7f4b4f34e09d42bfa73b58f4a230cffa.webp&w=128&q=75)

%20(2)-db0b6f38da9c485faf76e366793c9b9e.webp&w=128&q=75)