Introduction
In the fast-paced world of software development, ensuring the quality of code has become more critical than ever. Developers strive to identify and fix issues early in the development cycle to deliver robust and reliable applications. This is where SonarQube comes into play. We will delve into the depths of SonarQube, exploring its installation, usage, and significance in the realm of Java development and the SonarQube DevOps tutorial.
Overview
SonarQube, often referred to as just Sonar, is an open-source platform designed to assess and enhance code quality through static analysis. It acts as a powerful gatekeeper, continuously scanning codebases to identify bugs, vulnerabilities, and code smells. By addressing these issues early on, developers can minimize technical debt and produce high-quality code that forms the foundation of exceptional software. Stay connected till the end of this SonarQube tutorial to gain relevant coding insights.
SonarQube in Java
SonarQube enhances Java code quality and identifies issues, vulnerabilities, and technical debt. Learn how to use it effectively with these steps:
1. Installation and Setup:
Start by installing SonarQube and its plugins, configuring your Java project, and then running this command in your project directory using the SonarQube Scanner:

2. Code Analysis:
SonarQube checks Java code against rules and standards. For instance, if a method has high cyclomatic complexity:
public class Example {
public void complexMethod() {
if (conditioni) {
} else if (condition2) {
}
else {
}
}
}3. Review Issues:
SonarQube identifies code issues, such as smells, bugs, and vulnerabilities, and provides suggestions for how to fix them.
For example, if SonarQube detects a code smell of high complexity, it might suggest reducing the number of conditional operators in the code.
4. Applying Fixes:
Refactor the code to reduce complexity and improve readability:
public class Example {
public void simplerMethod() {
if (condition1) {
} else {
if (condition2) {
} else {
}
}
}
}5. Continuous Inspection:
Integrate SonarQube into your CI/CD pipeline for automated code analysis and instant feedback on every commit.
6. Security Scans:
SonarQube finds security vulnerabilities, like potential SQL injection, for instance.

SonarQube would flag this as a vulnerability and suggest using parameterized queries.
7. Custom Rules:
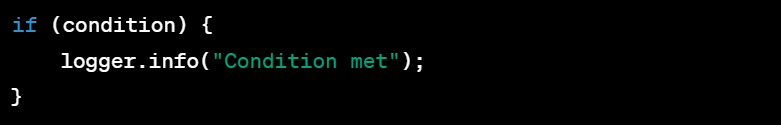
Create custom rules to enforce organization-specific coding standards. For example, ensure logging statements include sufficient context:
8. Technical Debt:
SonarQube calculates technical debt, helping prioritize code improvement. For instance, it might quantify the effort needed to address all identified issues.
SonarQube boosts Java code quality, enhancing reliability, security, and maintainability for a robust development process.
Static Testing
It finds defects, enhances code quality, and prevents issues early in development. Explore static testing with examples.
1. Code Review:
Consider a Java method that sorts an array using the bubble sort algorithm:
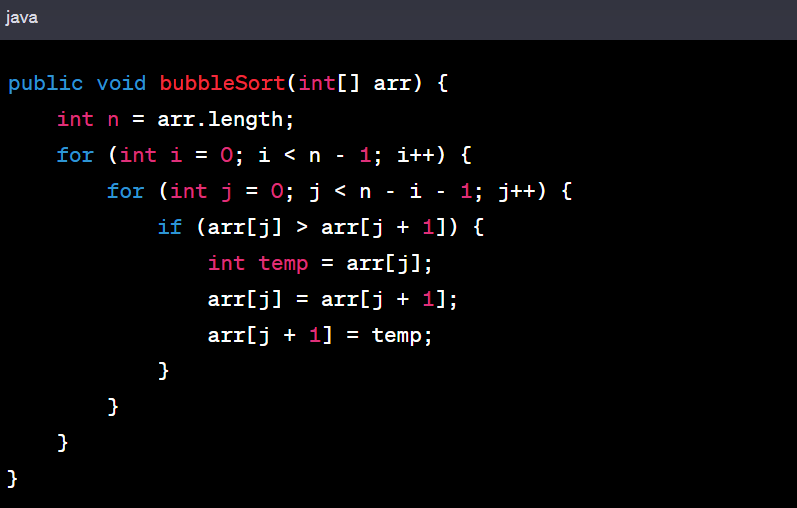
During a static code review, the following issues might be identified:
- The lack of comments explaining the algorithm's purpose and how it works.
- The absence of boundary checks, potentially leading to an 'ArrayIndexOutOfBoundsException'.
2. Automated Tools:
Static testing tools automate scanning for known code issues. For instance, they can detect potential memory leaks in C++ code.
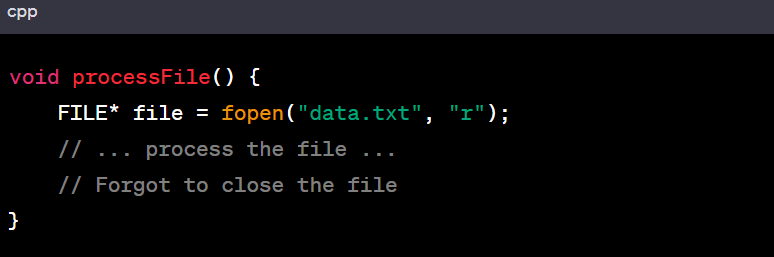
The tool can spot a missing 'fclose' statement and recommend adding it.
3. Security Analysis:
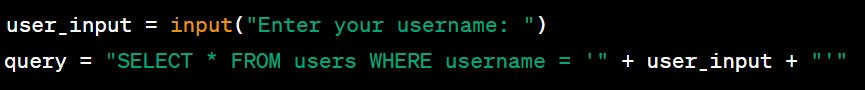
Static testing reveals security vulnerabilities. For instance, in Python, this snippet may be vulnerable to SQL injection:
4. Coding Standards:
Static testing enforces coding standards and best practices. In JavaScript, imagine a function without proper indentation and inconsistent naming:
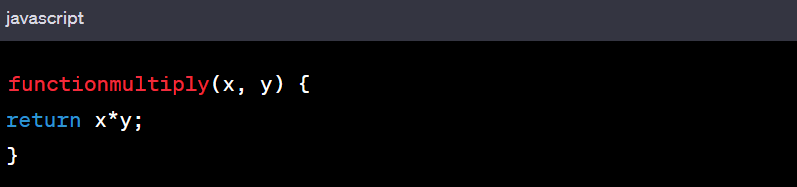
5. Documentation Review:
Static testing covers documentation too. For instance, in an API documentation review, we can catch inconsistencies in parameter descriptions and missing return value explanations.
Static Code Analysis
Static code analysis is vital in software development, analyzing code without execution to spot defects, security risks, standard violations, and other issues early. Explore it with examples.
1. Code Complexity Analysis:
Consider a Python function that calculates the factorial of a number:
def factorial(n):
if n == 0:
return 1
else:
return n * factorial(n - 1)
Static code analysis tools evaluate code complexity, considering metrics like cyclomatic complexity and nesting levels. High complexity may signal the need for refactoring to enhance readability and maintainability.
2. Null Pointer Dereference:
In Java, imagine the following code snippet:
public void process (String input) {
if (input != null) {
int length = input.length();
}
}3. Code Smell Detection:
Consider a C# method with a long parameter list:
public void ProcessData(int id, string name, double value, bool isActive,
DateTime timestamp, )
{
}
Static code analysis tools can identify code smells like "Long Parameter List" and suggest strategies like using objects to encapsulate related parameters.
4. Security Vulnerability Detection:
In a PHP application, imagine the following code susceptible to SQL injection:
$userInput = $_GET['input'];
$query = "SELECT * FROM users WHERE username =$userInput. “ ‘ “
Static analysis tools can recognize this vulnerability and recommend using prepared statements or parameterized queries to prevent attacks.
5. Coding Standards Enforcement:
Static analysis tools can enforce coding standards. In a Java class, consider inconsistent indentation:
public class Example {
public void method1() {
if (condition) {
}
}A static analysis tool can highlight the indentation issue and suggest correcting it for consistency.
6. Resource Leak Detection:
In C++, consider code that opens a file but forgets to close it:
Void processFile() {
FILE* file = fopen("data.txt", "r");
}Static analysis tools can detect this resource leak and advise adding the missing 'fclose' statement.
Features of SonarQube
Key features of SonarQube with examples:
1. Code Quality Metrics:
SonarQube provides a comprehensive set of code quality metrics that assess various aspects of your codebase. For instance, it calculates metrics like lines of code (LOC), cyclomatic complexity, and code duplication. Consider a Python function:
def calculate_square(x):
return x * x
2. Code Smell Detection:
SonarQube identifies code smells, which are patterns in the code that indicate potential problems. Imagine a Java class with a large number of methods:
public class ComplexClass {
}3. Security Vulnerability Detection:
Security vulnerabilities are critical to address. In a Ruby script with a potential security flaw:
user_input = gets.chomp
eval (user_input)
4. Code Coverage Analysis:
SonarQube supports code coverage analysis, measuring the percentage of code exercised by tests. For instance, in a Java class with unit tests:
public class MathUtil {
public int add(int a, int b) {
return a + b;
}
}
5. Duplication Detection:
Code duplication can lead to maintenance challenges. Consider duplicated code in a JavaScript application:
function calculateArea(radius) {
return 3.14159 * radius * radius;
function calculateCircumference (radius) {
return 2 * 3.14159 * radius;
}6. Customizable Quality Profiles:
SonarQube allows you to customize quality profiles, tailoring them to your project's needs. For instance, you can define a profile that enforces specific coding standards, like requiring comments for each method.
7. Trend Analysis and Historical Data:
SonarQube tracks code quality trends over time. It can display how code quality metrics have changed from one analysis to another, helping you identify improvements or regressions in your codebase.
SonarQube Installation and Setup
1. Prerequisites:
Before you begin, ensure you have Java installed (SonarQube requires Java 11 or later). You can check your Java version using the following command:

2. Download SonarQube:
Visit the official SonarQube downloads page (https://www.sonarqube.org/downloads/) and choose the version that matches your requirements. You can download the Community Edition (open source) or other editions if needed.
For example, if you're using the command line, you can use 'wget' to download the Community Edition:

3. Extract the Archive:
Once the download is complete, unzip the downloaded archive. Use the 'unzip' command for zip files or 'tar' command for tar.gz files:

4. Configure SonarQube:
Navigate to the extracted directory, and you'll find a 'conf' subdirectory. In this directory, locate the 'sonar.properties' file, which you need to configure. Open the file using a text editor:

You can customize settings like database connections, ports, and more in this file. For example, to change the default port to 9000:

5. Start SonarQube:
In the SonarQube directory, you'll find a script or executable to start the server. Run the following command:

This command starts the SonarQube server in the background. To stop it later, you can use:

6. Access the Web Interface:
Open a web browser and navigate to 'http://localhost:9000' (replace 9000 with the port you configured). You should see the SonarQube login page.
7. Log in and Set Up:
Log in using the default credentials (admin/admin). SonarQube will prompt you to change the password. Follow the on-screen instructions to complete the setup.
8. Analyzing Projects:
To analyze your projects, you'll need to use a build tool like Maven, Gradle, or others and integrate SonarQube analysis into your build process. This involves adding plugin configurations and running the analysis commands.
For example, using Maven, add a pom.xml to your project and configure the SonarQube plugin:
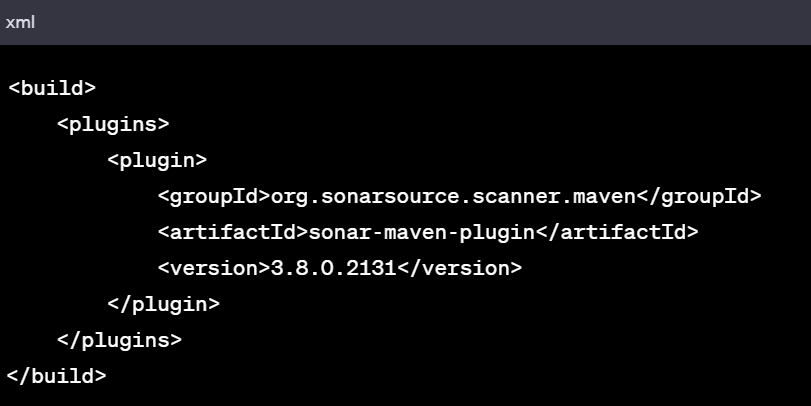
9. Run Analysis:
Run the analysis command using the build tool. For Maven:

10. View Analysis Results:
After analysis, go back to the SonarQube web interface. You'll see your project listed under "Projects." Click on the project to view analysis results, code quality metrics, and issues.
11. Custom Configuration and Plugins:
You can further configure SonarQube by adding quality profiles and rules and installing plugins to suit your project's needs.
Different Components of SonarQube
SonarQube components and their roles with examples:
1. SonarQube Server:
SonarQube server is the core component responsible for managing and coordinating the code analysis process. It hosts the web interface, stores analysis results, and provides APIs for integrating with various tools.
Example: When you access http://localhost:9000 in your browser, you're interacting with the SonarQube server's web interface.
2. Database:
The database stores configuration settings, project metadata, code quality metrics, issues, and historical data. SonarQube supports different databases like PostgreSQL, MySQL, and Oracle.
Example: SonarQube stores project information, analysis results, and issue details in the database for later retrieval and reporting.
3. Scanner:
The SonarQube Scanner is a tool used to analyze code and send analysis results to the SonarQube server. It's integrated into build processes to perform code quality checks.
Example: You run the scanner by executing commands like 'mvn sonar':sonar in a Maven project, which initiates the code analysis and sends the results to the SonarQube server.
4. Quality Profiles:
Quality profiles contain a set of rules that define coding standards, best practices, and potential issues for a specific language or technology.
Example: A Java quality profile might include rules that check for code duplication, cyclomatic complexity, and adherence to naming conventions.
5. Rules:
Rules define specific patterns, anti-patterns, and practices that SonarQube checks for during code analysis.
Example: A rule could be "Avoid using 'System.exit()' calls in production code" to prevent potentially harmful exits in Java applications.
6. Issues:
Issues are problems detected during code analysis. They can include code smells, bugs, security vulnerabilities, and more.
Example: An issue might be raised for an unused variable in a Python script, indicating potential dead code.
7. Dashboards and Reports:
SonarQube provides dashboards and reports that display code quality metrics, trends, and issues for projects, helping teams monitor and improve their codebase.
Example: A dashboard could show the trend of decreasing code complexity over the past few months for a specific project.
8. Plugins:
Plugins extend SonarQube's capabilities by adding new languages, rules, integrations, and reporting formats.
Example: A security plugin could provide additional security-focused rules and metrics to help identify vulnerabilities in your code.
9. Measures and Metrics:
SonarQube captures a wide range of code quality metrics, including code coverage, code duplication, complexity, and more.
Example: The "Code Coverage" metric shows the percentage of code covered by unit tests, helping you assess your test coverage.
Conclusion
By the end of this SonarQube tutorial, it must be clear that SonarQube boosts code quality and streamlines development. It analyzes code, offers insights, and enhances reliability and security. Using SonarQube in Java projects identifies vulnerabilities and enforces coding standards, elevating code quality and ensuring project success.
FAQs
1. What is SonarQube used for?
SonarQube is used for performing static code analysis and identifying bugs, vulnerabilities, and code quality issues in software projects.2. How do I run SonarQube using Docker?A. To run SonarQube using Docker, first install Docker, pull the SonarQube image, and then run a SonarQube container with the necessary port mapping.3. What are some common SonarQube interview questions?A. Some common interview questions about SonarQube include its benefits, how it works, its key features, and how to how to install sonarqube in Windows.
2. How do I integrate SonarQube into my Java project?
A. Integrate SonarQube by adding the SonarQube Scanner plugin configuration to your project's build tool (e.g., Maven, Gradle), and run the scanner to analyze your code.5. What types of issues can SonarQube identify in Java code?A. SonarQube can identify code smells, bugs, vulnerabilities, code duplications, and security vulnerabilities in Java code.


-d9bdeff6165f4eb1ba2adcebde78e961.svg)


-ae8d039bbd2a41318308f8d26b52ac8f.svg)
-35c169da468a4cc481c6a8505a74826d.webp&w=128&q=75)
-7f4b4f34e09d42bfa73b58f4a230cffa.webp&w=128&q=75)

%20(2)-db0b6f38da9c485faf76e366793c9b9e.webp&w=128&q=75)