Introduction
R is a powerful language mainly used for data analysis and statistics. It is often the answer if you have ever wondered how researchers or companies make sense of all the data they collect. We will help you understand the basics of R with this R Language Tutorial.
One great way to see R in action is through R programming examples. These are mini-lessons that show you how R works. And guess what? You don't always need to install software to try R. You can write and run R code directly from your web browser with an R language online compiler. It's a convenient way to practice without any setup!
Lastly, the R Studio Tutorial offers a deeper dive for those who want a more structured learning path. RStudio is an environment that makes using R even easier. It's a workspace tailored for R with special features to help you code better.
Overview
Two major languages often pop up when learning data analysis: R and Python. The debate of R language vs Python is a common one. Both have their strengths. Python is versatile and is used in a broad range of applications. R is specialized in statistics and data visualization.
You need a tool called an R language compiler to write and execute R code. You give it your R code, and it translates that into a language your computer understands.
This R Language Tutorial will discuss the specifics of R and help you understand its features and how it stands out in data sciences.
What is R Programming?
R programming is a language primarily used for
- Data analysis
- Statistics
- Graphics
It allows users to handle data, perform statistical analyses, and create visual representations of data through graphs and charts.
R Programming Examples
Calculating the average of numbers
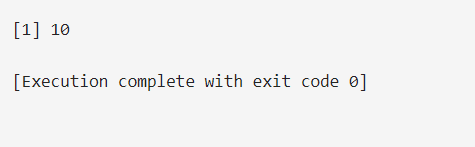
To find the average of numbers 5, 10, and 15, you'd write:
CODE:
numbers <- c(5, 10, 15)
average <- mean(numbers)
print(average)
Output
Example 2
Plotting a bar graph of sales data
Imagine you have sales data for three months
- January
- February
- March
You want to visualize this data with a bar graph.
CODE:
months <- c("January", "February", "March")
sales <- c(100, 150, 130)

barplot(sales, names.arg=months, main="Sales Data", col="blue", ylab="Number of Sales")
Output
History of R Programming
The Genesis of R
R programming evolved from the 'S' programming language. John Chambers and colleagues created it at Bell Laboratories in the 1970s. 'S' was a data analysis and graphics language.
The transition from S to R
Ross Ihaka and Robert Gentleman at the University of Auckland in New Zealand began working on R in the early 1990s. They intended to develop a free software alternative to 'S.' R's initial public release was in 1995.
The growth of R
R grew in popularity over time because of its open-source nature, which allowed anyone to contribute to and develop it. The Comprehensive R Archive Network (CRAN) was created to hold thousands of user-contributed packages that enhance the capabilities of R.
RStudio's Emergence
RStudio debuted in 2011. It's an R-specific integrated development environment (IDE). This IDE makes using R user-friendly and powerful. RStudio played an important part in making R accessible to a broader audience by providing capabilities like:
- Debugging
- Package development tools
Modern Day R
R is a leading tool in
- Data analysis
- Statistics
- Visualization
Its vibrant community, constant updates, and the sheer volume of available packages ensure that R remains at the forefront of data science.
Features of R programming
1. Comprehensive Statistical Analysis
R excels at providing various statistical methods, from simple tests to complex analyses. Whether comparing means or running a multi-layered regression, R has you covered.
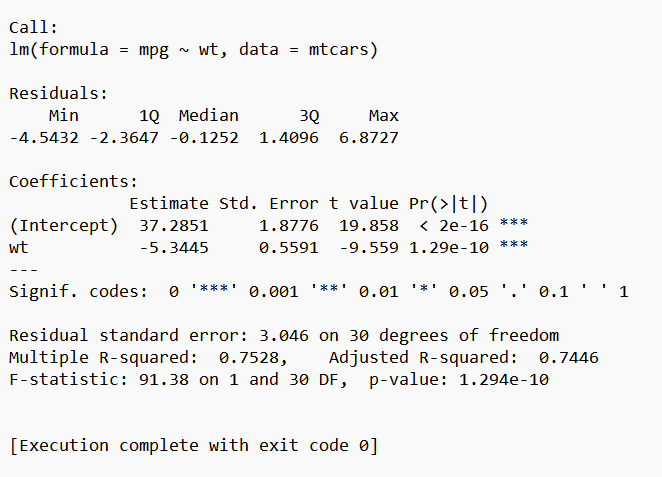
Example
CODE:
# Simple linear regression
data(mtcars)
fit <- lm(mpg ~ wt, data=mtcars)
summary(fit)
This code performs a linear regression to understand the relationship between the weight (wt) of cars and miles per gallon (mpg).
Output
2. Superior Data Handling and Storage
R offers powerful data structures like:
- Vectors
- Matrices
- Data frames
- Lists
This makes data manipulation and storage simple.
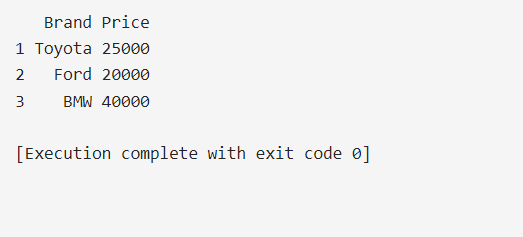
Input
# Creating a data frame
cars_data <- data.frame(
  Brand = c("Toyota", "Ford", "BMW"),
  Price = c(25000, 20000, 40000)
)
print(cars_data)
This code will create and display a small data frame of car brands and their prices.
Output
3. Graphical Capabilities
R's robust graphical capabilities are one of its standout features. From basic plots to intricate visualizations, R lets you visually represent data in many ways.
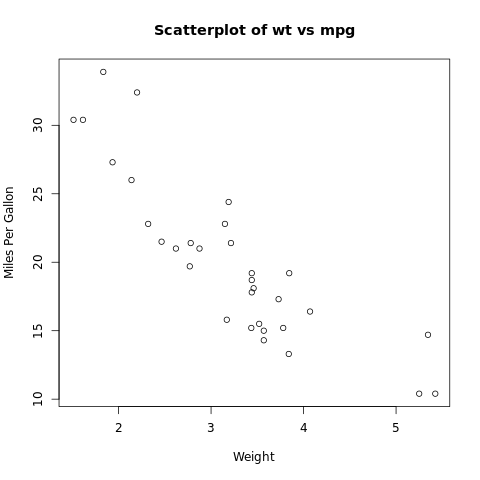
Input
# Simple scatter plot
plot(mtcars$wt, mtcars$mpg, main="Scatterplot of wt vs mpg", xlab="Weight", ylab="Miles Per Gallon")
This will produce a scatter plot comparing car weights with their fuel efficiency.
Output
4. Open Source Nature
R is open source. Anyone can review its source code, make improvements, and develop bespoke packages. As a result, R boasts a vast repository of packages for diverse functionalities.
5. Compatibility and Integration
R can integrate with many data processing technologies. It's compatible with tools like Excel, databases like MySQL, and even languages like Python.
Example
Using the RMySQL package, you can fetch data directly from MySQL databases into your R environment.
6. Active and Supportive Community
R's community is active, ever-growing, and always eager to help. This ensures continuous learning and the availability of cutting-edge packages and solutions.
Why use R Programming?
1. Comprehensive Data Analysis Tools
R has a rich set of tools for almost every kind of statistical analysis you might want to perform. Be it hypothesis testing, regression analysis, or advanced statistical modeling, R is equipped to handle it.
Example
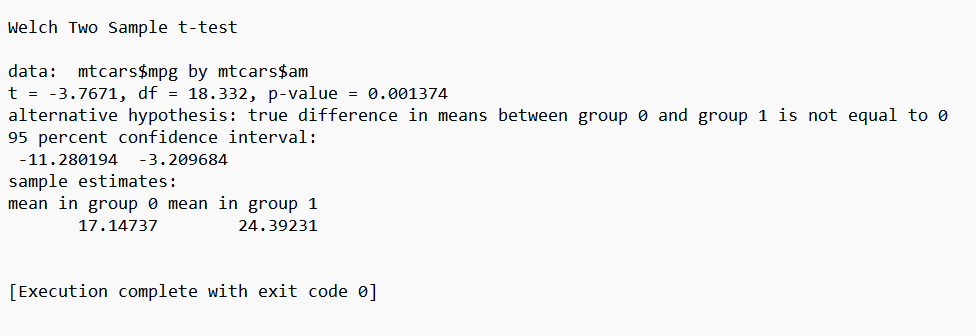
# Performing a t-test
t_result <- t.test(mtcars$mpg ~ mtcars$am)
print(t_result)
In this snippet, we're using a t-test to check for a major difference in miles-per-gallon (mpg) between automatic and manual (am) cars.
Output
2. Advanced Visualization Capabilities
From basic charts to advanced interactive visualizations, R provides numerous libraries like ggplot2, shiny, and lattice, making data visualization a breeze.
Example
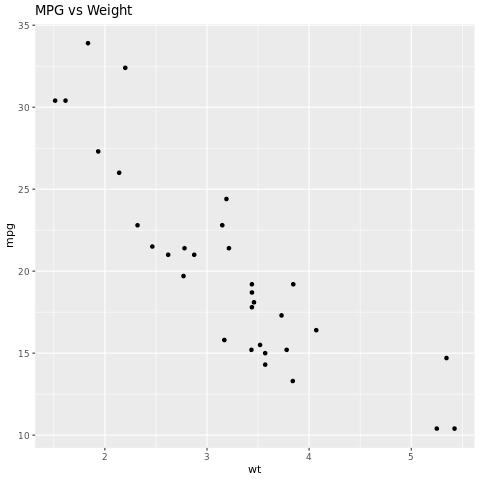
library(ggplot2)
ggplot(mtcars, aes(x=wt, y=mpg)) + geom_point() + ggtitle("MPG vs Weight")
This code plots car weights against their fuel efficiency using the ggplot2 package.
3. Robust Package Ecosystem
With the Comprehensive R Archive Network (CRAN), users have access to a vast repository of packages tailored for various functionalities, from data manipulation (like dplyr) to web scraping (like rvest).
4. Data Manipulation Prowess
R offers packages like dplyr and tidyr that make data wrangling, tidying, and manipulation incredibly simple.
Example
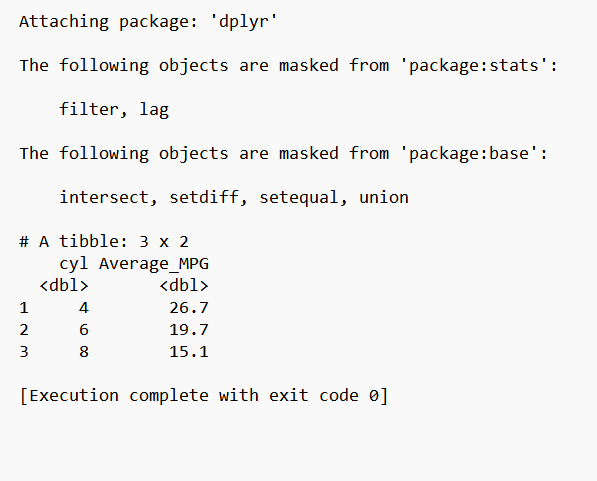
library(dplyr)
mtcars %>%
  group_by(cyl) %>%
  summarise(Average_MPG = mean(mpg))
Here, we're grouping cars by the number of cylinders and calculating the average mpg for each group.
Comparison between R and Python
Feature/Aspect | R | Python |
Origin and Primary Purpose | Developed from the 'S' language for statistics and data analysis. | A general-purpose language that evolved into a data science giant with packages like NumPy, Pandas, and Scikit-learn. |
Data Analysis & Visualization | A rich ecosystem with packages like ggplot2 for visualization and dplyr for data manipulation. | Pandas is used for data manipulation, while Matplotlib and Seaborn handle visualization. |
Machine Learning | Packages like Caret and RandomForest offer diverse algorithms for machine learning. | Dominates with libraries like scikit-learn, TensorFlow, and PyTorch for machine learning and deep learning. |
Flexibility and Application | While powerful in data analysis, R also supports web applications via Shiny. | Highly flexible and suitable for web development (with Django and Flask), automation, deep learning, and more. |
Learning Curve and Syntax | Syntax tailored for statisticians might seem unique, but it is powerful for data tasks. | Cleaner and more readable syntax is often hailed as suitable for beginners. |
Community & Support | A dedicated community mainly centered around statistics, data analysis, and research. | A vast community covering diverse domains, from web development to data science. |
Data Manipulation Mastery: Utilizing R's dplyr and tidyr Packages
Data manipulation is often the preliminary step in data analysis. With R, you don't have to look far. The dplyr and tidyr packages are two of the most powerful tools available. They enable you to transform and restructure your data with ease.
dplyr: Your Data Wrangling Assistant
dplyr provides a set of verbs that allow you to perform the most common data manipulation tasks:
- Select() - Choose specific columns.
- Filter() - Pick rows based on criteria.
- Arrange() - Sort your results.
- Mutate() - Create new variables/columns.
- Summarise() - Aggregate your data.
Example
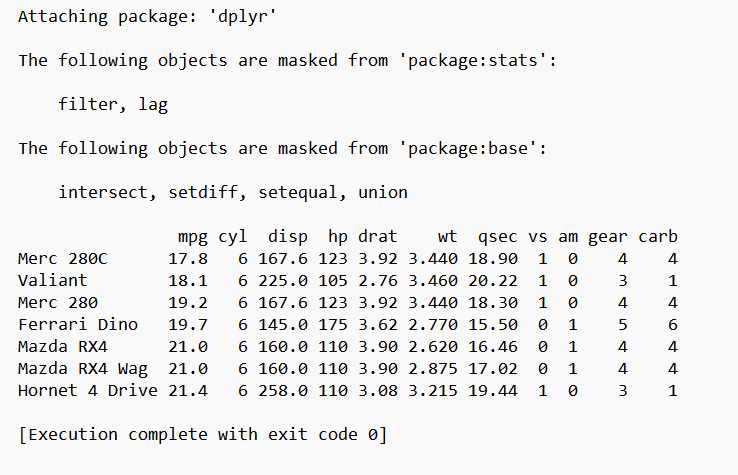
library(dplyr)
data(mtcars)

# Filtering cars with 6 cylinders and arranging by mpg
mtcars %>%
  filter(cyl == 6) %>%
  arrange(mpg)
Output
tidyr: Organizing Messy Data
Data is often messy. tidyr offers functions to help you tidy your data:
- Spread() - Turn columns into rows.
- Gather() - Turn rows into columns.
- Separate() - Split one column into multiple columns.
- Unite() - Combine multiple columns into one.
Example
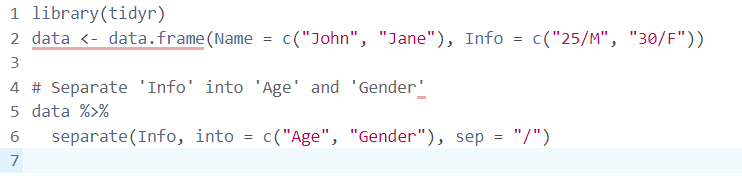
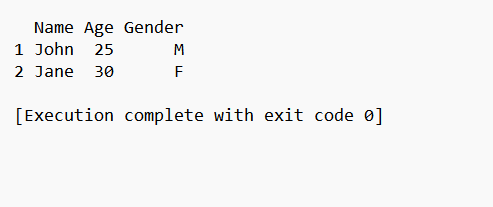
CODE:
library(tidyr)
data <- data.frame(Name = c("John", "Jane"), Info = c("25/M", "30/F"))

# Separate 'Info' into 'Age' and 'Gender'
data %>%
  separate(Info, into = c("Age", "Gender"), sep = "/")
Output
Conclusion
We have discussed the essentials of R programming in this R Language Tutorial. R's capabilities shine brightly, from its foundational features to powerful data manipulation tools like dplyr and tidyr.
We've compared R with other languages, notably Python, highlighting its strengths. Focusing on real-world applications, we showcased how R is utilized across various fields. As we conclude, remember that this is just the beginning. The R landscape is vast, and continuous practice is the key to mastering it.
FAQs
1. What does CRAN stand for in R?
The acronym CRAN stands for Comprehensive R Archive Network. It's a repository where users can locate and install R packages.
2. How can I put an R package together?
Use the command install.packages("package-name") in the R console. Replace "pkg-name" with the name of the desired package.
3. How do I keep my R packages up to date?
Run the update.packages() command in the R console. This brings all installed packages up to the most recent version.
4. What is the distinction between R and RStudio?
R is a programming language, and RStudio is a popular integrated development environment (IDE) for using R effectively.


-d9bdeff6165f4eb1ba2adcebde78e961.svg)


-ae8d039bbd2a41318308f8d26b52ac8f.svg)
-35c169da468a4cc481c6a8505a74826d.webp&w=128&q=75)
-7f4b4f34e09d42bfa73b58f4a230cffa.webp&w=128&q=75)

%20(2)-db0b6f38da9c485faf76e366793c9b9e.webp&w=128&q=75)