Financial Analysis is the examination of an organisation's financial pieces of information to understand the business scenario and make calculative decisions. This process of analysis includes the working capital management, calculation of free cash flows & profitability over a specific time.
It also highlights the decisions made at the beginning and their resulting outcome. One can understand the difference between the two and point out the inaccuracies or overlooked pieces to rectify them for the upcoming cycle.
The Financial Analysis establishes the image of the business in terms of its stability in the market. It reflects if the company is significant for making investments.
If we break it down, there are primarily two types of Financial Analysis;
Fundamental Analysis- In this process, the data collected after examining the financial statements are analysed and used to determine the intrinsic value of any security.
Technical Analysis- This analysis process approaches a security’s value differently as it focuses on trends in value.
The process of Financial Analysis carries utmost importance, so high professionals do it, particularly those who have financial analysis certification. The financial analyst’s share of work is to thoroughly scrutinise the company's financial statements and reduce them to make favourable decisions for the business. Examining the financial statements means checking and reviewing a company's cash flows, income statement, and balance sheet and compiling the reports to sketch out the current performance structure of the business.
Financial Analysts play a huge role in any organisation as the higher authorities look forward to the analysis made by them and their recommendations to improve their work structure.
There are several things that a financial analyst should consider and be aware of to assess the real-time condition of the business properly. For instance, an analyst must be informed about the recent developments in their field and the economic scenario in which the business is running.
Without a financial analyst, it is beyond one’s knowledge to determine which product the strength and weaknesses of a business lie or to understand the financial statement and make analytical forecasts of profit and loss.
An analyst works both externally and internally for an organisation. In external analysis, the professional reviews the company's financial statements and other necessary disclosures to conclude whether or not to invest in it. In internal analysis, the analyst examines if the investment made on a particular asset is worth compared to its return on investment.
A financial analyst’s significance in an organisation makes it one of the high-paying job positions in a company. One must gain the relevant financial analysis certification through financial analysis certification courses to obtain this reputed position.
There are various financial analysis courses for different work of action. Examples are financial planning and analysis courses, financial statement analysis courses, financial risk management courses, and many others.
One can opt for these courses and financial analysis training to secure a position as Financial Analyst.
Finance can be perceived as the working language of a business, without which nothing can work out. One must have financial analytical skills when investing in a fixed asset or any other venture. This active tool guides businesses in the correct direction for optimum utilisation of their funds. The essential information for conducting financial analysis comes from assessing a firm's financial statements.
The financial analysts then use this prominent information to procure ratios, current trends, and various other factors that can help to compare the business and to know if it's worthy of investing. Hence, financial analysis at regular intervals is needed to check on the stability and development of the business environment.
In finance, the work goes according to a specific calendar called the financial year, which starts in April and ends in March. But within these 12 months, firms also present their financial statements quarterly, i.e., every three months. People and businesses interested in any company can analyse these financial statements and extract useful information accordingly.
An investment decision plays a massive role in a business, so its approach must be calculative and accurate. This is where financial analysis comes in, which interprets and values the financial data so the company can draw its solutions for prospects.
After the financial analysis process (which includes assessing a company’s past and present performance), a business decides whether to invest in it or not. Apart from this, a financial analysis reflects an enterprise's financial health, which again helps in forecasting the profits and losses associated with the company. These predictions also assist in outlining the budget allocation for the respective business.
A company becomes aware of a list of things after conducting a Financial Analysis. Some of them are listed below;
The short-term liquidity position of an enterprise.
The amount of financial risk involved in a business.
Gross earnings of a firm.
Company’s ability to utilise its financial resources.
The long-term solvency position of a business.
A company’s efficiency in purchasing and managing its resources cost-effectively.
Progress of different sectors inside a firm
Overall administration of a business
Financial Analysis is a structured process that goes through various steps, from analysing performance to setting goals according to the financial forecasts and making strategies based on the outcomes. The sole aim is to know the problems and opportunities through financial predictions and try to turn most of the things in favour of the business and gain profits from it.
So, to conduct financial analysis, one needs to take several steps;
Analysis of Income Statement- The initial stage of financial analysis is mostly the evaluation of the income statement, which provides knowledge about the company’s Profits & Losses over the analysis period.
Evaluation of Balance Sheet and Leverage Ratios- The assessment of balance sheet and leverage ratios constitutes an essential part of the financial analysis. Both of these are divided into various subcategories to work on properly. Ratios aim to reflect the efficiency, solvency, liquidity and profitability of the business in generating revenue and its management of assets.
Cash Flow Statement Analysis- This step of the analysis will let us know about the inflows and outflows of cash in a company and understand its position. It is divided into three components: Cash flow from Operating Activities, Cash flow from Investing Activities, and Cash flow from Financing Activities.
As we already know, financial analysis is conducted by examining a business's financial statements and other necessary components. Preparing a financial statement is not enough; its interpretation and evaluation make it helpful for a business.
A concrete report made after a financial analysis is useful to several people like creditors, investors, regulatory authorities, and management. Financial Analysis is thus a powerful practice for a variety of people depending on their interests and objectives in gaining knowledge about the financial situation of a business.
The primary data for financial analysis is the firm's financial statement, which provides the know-how about the company’s financial condition and performance. Apart from a firm’s annual report, its quarterly reports and financial press releases also play a vital role in catering a good amount of information. When a company publishes annual reports, it contains financial statements, auditor’s report, director’s report, and notes to financial statements.
These are authentic sources of information for anyone as it comes from the business itself. Other than this, the Stock Exchanges also maintain the consolidated annual reports of the company’s performance, which they also publish for the shareholders to gather their share of information. Last but not least, the Business Periodicals are there to enrich the common public about the financial situation of the companies.
The initial collection of financial data is quite messy and must be transformed and prepared professionally, after which it can be analysed properly. The collected data is modified and presented in three different components of the financial statement: Cash Flow Statement, Profit & Loss Statement, and Balance Sheet. Then these financial statements are analysed to produce ratios and concrete information about the happenings of business on which one can rely.
Data preparation not only means the collection of data but the whole process of collecting the data, cleansing, structuring, and organising the data so that professionals can analyse it.
Financial statement analysis is the evaluation of the company's balance sheet while comparing it to the profit & loss statement to understand the strength and weaknesses of the business. By analysing the financial statement properly, one can comprehend the working structure of the business. Different users do financial statement analysis for their separate purposes; a stockholder determines whether the company is profitable to invest in and does they make optimum utilisation of the resources.
The government uses the financial statement to check the legitimacy of the company’s fiscal decisions and accounting procedures. The interpretation of financial statements is essential to measure the efficiency, profitability, financial soundness, and prospects of the business units.
This quantitative analysis method gives insightful information about a company’s liquidity, efficiency, and profitability by studying its balance sheet and income statement.
Ratio Analysis is a tool that external analysts mainly use to obtain data that reflects the company's financial performance.
There are various uses of Ratio Analysis, such as;
Comparing similar firms of the same industry to understand the firm’s position in the business market.
Degree of efficiency in managing resources.
To search and identify a trend in the financial performance of the company.
There are various types of ratios that are considered while carrying out the ratio analysis, such as;
Liquidity ratios measure the company’s ability to manage its debts.
Market prospect ratios guide the investors to predict the return on their investments.
Coverage ratios can help one draw a trend to forecast the company’s financial position in the market. This also helps to check if the commitments are being met.
Profitability Ratios measure the profit earnings ability of a company considering the expenses.
Solvency Ratios help to measure a company’s long-term financial feasibility in the market.
Dupont Analysis is a model prepared for the detailed assessment of a company’s profitability. One of the significant features comprised by this tool is it avoids misleading conclusions and gives the most accurate results on which the company can rely. In Dupont Analysis, the different components of Return on Equity(ROE) are broken down and analysed to get concrete results. The three components in which ROE is separated are:
Operating Efficiency- It is measured by net profit margin and reflects the net income generated by the company per unit of sales.
Asset Efficiency- It shows the total asset turnover and also speaks about the sales per unit of asset used.
Leverage- The equity multiplier determines it.
You would learn about the business's operations by analysing the first two components. In simple terms, the more significant these components reflect, the more productive the business is. On the other hand, the last component, i.e., financial leverage, depicts the business's financial activities. The more leverage the company takes, the higher the risk of default.
As the Dupont analysis determines the change in ROE, it also allows the investor to examine the various financial components contributing to creating ROE changes.
An investor can use this analysis to compare the operational efficiency of two firms.
Peer Group comparison is one of the widely used analysis and performance evaluation methods. Here, a peer group refers to a group of companies that share the same characteristics. These groups are widely known for their influential nature on one another.
Another most important aspect of peer groups is the comparison and competition that goes on between them. It forces them to enhance their performance and give tough competition to other companies. These comparisons help them to identify the trends & performance of the other as well as give them a chance to find opportunities that can help them in scaling up.
In simple terms, regular cash flow statements reflect the movement of cash and cash equivalents in a company. One can determine the company’s cash and debt obligations management by analysing the cash flow statement. The cash flow statement is a crucial statement presented by the company, which complements the balance sheet and income statement. Thus, one gets the whole financial statement for analysis. The cash flow statement breaks down the exchange of each penny, and everything is reflected on the statement, which analysts examine further.
This statement helps the creditors know the company's liquidity and if there’s any cash available to the company to pay out its debts. Apart from creditors, it is insightful for the investors as it reflects the management of cash by the company and its financial supremacy in the market.
There are various components present in a cash flow statement, such as
Cash flow from operating activities
Cash flow from financing activities
Cash flow from investing activities and some non-cash activities as well.
Hence, regular cash flow statements reflect the financial health of the company. By studying this, an investor can get clarity on the cash generation ability of the company and its financial well-being in the market.
In simple terms, Checks and Balances refer to the process that enables the company to reduce its mistakes and decrease the use of centralisation of power. It is essential to prevent an individual from making all the decisions of a company; thus, checks and balances are important in any business.
In financial statements, checks and balances are important to prevent fraud, and there should not be an individual who controls all parts of financial transactions. This process ensures separate handling of receipt and deposit functions.
As we already know, data is required to conduct a financial analysis. But the initial stage of the assessment is to convert the data into ratios to get more clarity while analysing. Financial ratios are taken from the values presented in the financial statements to gather helpful information regarding the company.
Several ratios play a key role in the process of analysing the financial statement;
Working Capital Ratio
Earning-per-share
Debt-to-equity ratio
Quick Ratio
Return on Equity
There are plenty of such ratios, but it depends on the analysts which ratio seems more favourable to them for carrying out the analysis and gaining a greater understanding of a company’s future potential.
The profit & loss statement or a company's income statement reflects the profit/losses, revenues, and expenses over a specific period. It says a lot about the company’s sales, its management of expenses, and the balance of profit while incurring expenses.
The profit & loss statement is made by taking several things under consideration. Among these, some important categories are mentioned below;
Revenues/Sales
Marketing and Advertising Expense
Cost of Goods Sold
Taxes
Administrative Expenses
Interest Expense
Net Income
After preparing the Profit & Loss statement, the main job is to analyse them properly to understand the business's financial health. Some ways of assessing the P&L Statement are;
Comparison with previous year's numbers
Trend Analysis
Assessing the margins like gross profit margin, operating margin, etc.
Rates of Return
Among the three financial statements (Profit & Loss Statement, Balance Sheet, Cash Flow Statement), a balance sheet is considered to be the most prominent one. In simple terms, a balance sheet reflects the total number of assets acquired by the company besides its liabilities. It also reflects whether the assets are financed through debt or equity.
The balance sheet works on the basic equation of Assets=Liabilities+Equity.
There is a particular structure to making a balance sheet, while it is also true that it can differ from organisation to organisation. Some of the components of it are;
Current Assets
Non-Current Assets
Current Liabilities
Non-Current Liabilities
Shareholder’s Equity
The balance sheet plays an important part in evaluating the financial health & position of a company in the market. It depicts the company’s performance and efficiency over the period.
The purpose of liquidity ratio analysis is to measure the short-term solvency of a business. It reflects the ability of the company to meet its short-term goals. Thus, it suggests the pace at which the assets of a business can convert into cash. Moreover, it also ensures smooth cash flow to meet the liabilities and day-to-day business operations. All in all, it maintains the everyday working of a business.
The common liquidity ratios are;
Current Ratio- Working Capital Ratio- It measures a company’s current assets concerning its current liabilities to determine the business's short-term solvency.
Cash Ratio- This ratio measures the company’s total cash and cash equivalents relative to its current liabilities. It checks the company’s ability to meet its short-term debt obligation with liquid assets.
Quick Ratio- (Current Assets – Inventory – Prepaid Expenses)/(Current Liabilities)
The SWOT (strengths, weaknesses, opportunities, and threats) analysis is done to assess the company’s strengths & opportunities and then to develop strategic planning to overcome all the weaknesses & threats. This analysis examines internal and external factors associated with the company and then evaluates the collected data based on the current scenario and future potential.
SWOT Analysis gets prominence because of its practical take on the process. Its identification of strengths, weaknesses, opportunities, and threats leads to factual analysis and logical ideas incorporating analysis techniques that guide the business to make fruitful decisions instead of making strategies that might have loopholes.
Let us briefly understand the elements of SWOT Analysis;
Strengths- The company's aspects, constituting the parts in which the company excels.
Weaknesses- The areas of a business that are weaker in comparison to other parts and where the business needs to work and improve itself.
Opportuities- Favourable external factors that can help an organisation in excelling up.
Threats- Factors that have the potential to provide harm to a business.
The analysts present the SWOT analysis as a matrix of all the elements of SWOT to combine them and make strategies that deal with the weaknesses & threats of the business by appropriately using its strengths & opportunities.
We have already understood the concept of the Cash Flow Statement, but the main part is to analyse and extract the relevant pieces of information from it. To do that, we must analyse each component of the cash flow statement.
Clash flows show us the different sectors through which cash inflow and outflow from the company in a given accounting period. It is essential to know the sources of your income and expenses to regulate and manage them as per your choice. This analysis shows the basics of a business, whether cash is available or not to run the business operation and complete the transactions.
By continuously analysing the business's cash flow statement, the users can see the potential and position of the business in the market and predict the future. It can even reflect the working system of business; for instance, if a company’s investing cash flow is positive, but the operating cash flow is negative, it might be understood that the business is selling off its assets to pay the operating expenses.
The analysis keeps the company on the ground and always provides the reality check of their actual worth and available money to run the business. While examining the cash flow statement, you will know the free cash flow (money left after clearing operating expenses and capital expenses) that the business has and can reflect its ability to purchase further assets or pay the interests.
In the world of microeconomics, Margin analysis is a widely used technique. It examines the worth of the expenses that are made to gain benefit. It compares the cost, financial decision, or any business activity with its outcome to know if it has the potential.
For example, if a company adds to the production by a small margin, its impact will be projected on the production quality and the number of resources used. Then the company can use margin analysis to understand the impact of the changes on its outcome. However, the margin analysis is also criticised for its idea of a “perfect market,” which is not present in the real world.
It simply calculates the ratio between the values of a company’s sales and revenue and the worth of its assets. It depicts the efficiency with which the company is using its assets to generate revenue. Hence, it can be considered a determinant in analysing the company's performance. The higher the ratio comes in the calculation, the better the company’s performance, as the higher ratio depicts the conscious use of assets in generating higher revenue. Interestingly, the asset turnover ratio is also an integral component of Dupont analysis.
This ratio can be calculated by dividing the net sales into the average of total assets. As the two key components of this ratio are net sales and total assets, an increase in asset sales or purchases can impact the ratio. The ratio varies from sector to sector, and it is mostly observed that retail businesses have higher sales turnover and less number of assets, thus creating a higher asset turnover ratio.
Investors consider this ratio when comparing companies coming from similar sectors or industries.
However, this ratio can also misguide one between a company’s plan and its actual performance. For example, a company might purchase more assets to expand its business. Still, the ratio will reflect the company's poor performance as it will decrease because of the increase in assets.
Online Financial Analysis Certification Courses offer a wide range of benefits in comparison to the available offline courses.
Let’s look at some reasons why opting for financial analysis courses online can be a profitable deal for the future rather than going for offline courses.
Flexibility- The level of flexibility that an online course can provide is incomparable to any other form of education. The flexibility in terms of time and learning pace is a boon in this dynamic and progressive world where people scale up themselves daily with the addition of skills.
Global networking- Online programs providing financial analysis certification courses or financial analysis training can be a great place to widen your network for the future. It offers you a platform to connect with professionals in your field, peer groups, mentors to take guidance from, and industry experts worldwide.
Convenience- Online Financial Analysis courses are the most convenient as they don’t require travelling to attend classes. Even the study material is accessible to you from the comfort of your home.
Cost-Effective- Online financial analysis courses are comparatively cheaper than offline courses. Apart from that, you can also save your travelling and accommodation expenses. As a whole, it helps you get quality mentorship at a minimal cost.
A financial analysis certification course will benefit your career if you’re aspiring to pursue a career in Financial Analysis or related fields.
The following areas/topics will be covered under the Financial Analysis Course;
Introduction to Financial Analysis
Basics of Excel
Building the three components of the financial statement from scratch (Balance sheet, Profit&Loss statement, Cash flow statement)
Ratio Analysis
Dupont Analysis
Peer Group Comparison
Liquidity Analysis
SWOT Analysis
Margin Analysis
Cost Analysis & Cost Allocation
Working Capital Management & Cash Budgeting
Financial Forecasting
Understand Financial Instruments & Financial Market
Financial Regulations
Risk Management
According to Allied Market Research, the global financial analytics market was valued at $7.6 billion in 2020 and is expected to reach $19.8 billion by 2030. The COVID-19 pandemic has had a significant role in increasing the valuations with its positive impact. Because of the growing uncertainty in businesses during this period, financial analytics became important to keep up with the volatile market and to make correct financial decisions.
During the forecast period (2021-2030), the CAGR is forecasted to be at 10.3%. Some of the crucial reasons behind this are an increase in the adoption of computing devices, a rise in advanced storage capabilities, and growth in the innovation of new analytic tools.
As a business needs to carry out financial analysis to survive in the market with profitability, it never lowers the demand for financial analysts in the business world.
Especially in India, with the increase in the number of businesses, the need for financial analysts or the professions related to financial analysis will also increase.
After the pandemic and the programs initiated by the government to support Indian brands/businesses, there is no doubt that soon we will encounter a wave of entrepreneurs, which depicts the need for financial analysis as well.
Various factors affect the salary of a financial analyst in India, including location, skills, and the experience level of the professional.
The amount of compensation for a financial analyst depends on the firm's demand and location.
Here are the top cities in India and the average salary offered to financial analysts listed below.
Noida: INR 6,34,768 per year.
Delhi: INR 5,39,288 per year
Hyderabad: INR 4,94,596 per year
Mumbai: INR 4.81,834 per year
Chennai: INR 4,56,197 per year
The salary of a financial analyst also depends on the experience level like any other profession. Here are the salary of professionals as per their level of experience;
Beginner level (with one year of experience)- Average compensation of ₹342,516 per annum
Financial Analysts with 1-4 years of experience can get an average salary of ₹387,058 per annum.
An experienced financial analyst with 5-9 years of experience gets a compensation of ₹588,755 per annum.
An expert level Financial Analyst with almost 10-19 years of experience can earn an average of ₹850,683 per annum.
Financial Analysis- ₹459,431per annum
Financial Reporting- ₹503,358 per annum
Data Analysis- ₹477,058 per annum
Microsoft Excel- ₹403,292 per annum
Accounting- ₹404,073 per annum
The average salary of a financial analysis specialist in the United States depends on various factors like location, experience, and the acquired job title of the professional.
New York- $82,472 per annum
Washington DC- $82,367 per annum
Chicago, IL- $77,236 per annum
Atlanta, GA- $74,820 per annum
Less than 1 year- $65,335 per annum
1 to 2 years- $67,365 per annum
3 to 5 years- $74,669 per annum
6 to 9 years- $81,104 per annum
More than 10 years- $83,993 per annum
1000+
Top Companies
50%
Average Salary Hike
Top 1%
Global Universities
Analyse the environment, conduct user research across online and offline retail shoppers, suggest features of improvement for a seamless experience and metrics to measure your success for a niche e-commerce apparel brand.
Establish the target market for hourly booking of hotels, user needs, growth opportunities, and build a Minimum Viable Product (MVP) and identify relevant success metrics.
Analyse and improve the transnational funnel of the online ticketing platform.
Help increase the number of recharges for Freecharge by improving the growth hack funnel. Propose retention, referral and revenue growth hacking strategies to achieve business goals.
Conduct an analysis of key competitors of a healthcare product
Create a business plan for cab-sharing app’s expansion to the Indian market and represent it using the Business Model Canvas
Design and sketch a wireframe for a hypothetical health-based app that tracks and monitors health and fitness
Create a product backlog and figure out epics and user stories for a feature for an OTT platform
Prioritise tasks and feature updates for a cab-sharing app’s operations
Financial Statements are the summarised data collected by the entity that shows the company’s financial condition in the given period.
Financial Analysis is the evaluation of the financial statement of a business to understand its financial health, stability, and performance in the market. Financial Analysis plays a key role in the development of a business.
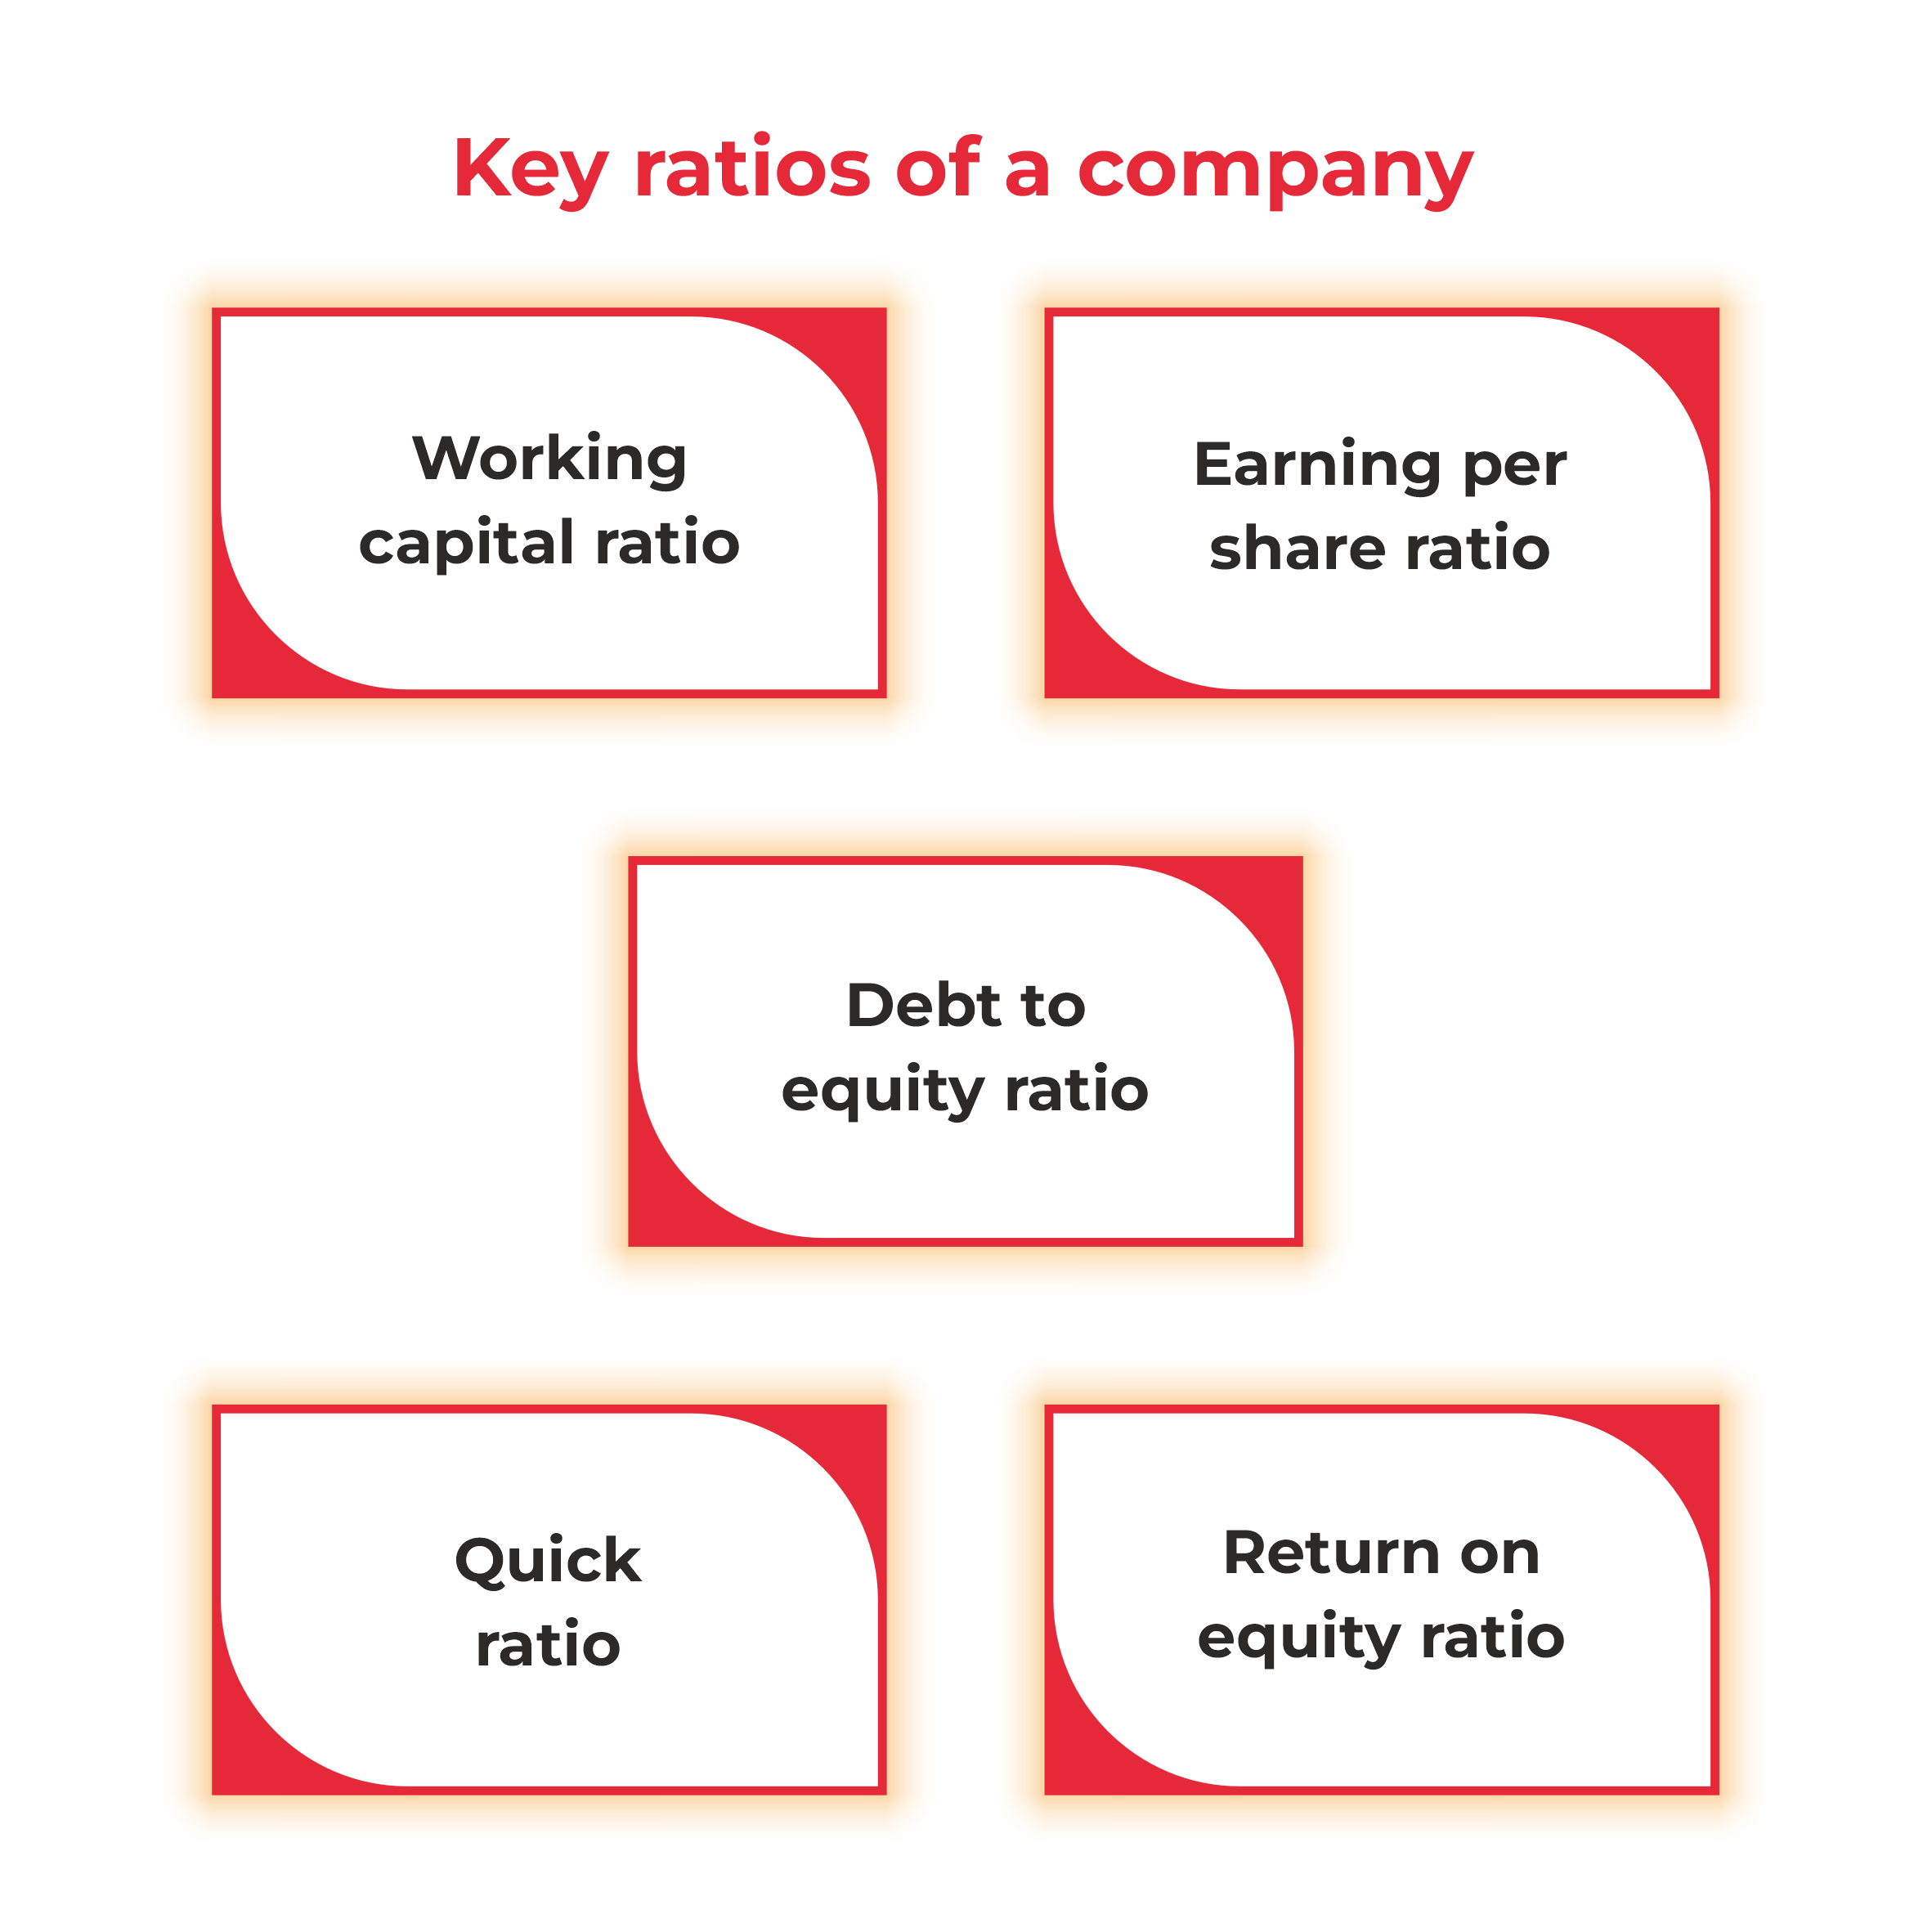
The three key components of a financial statement are;
Balance Sheet
Cash Flow Statement
Profit & Loss Statement
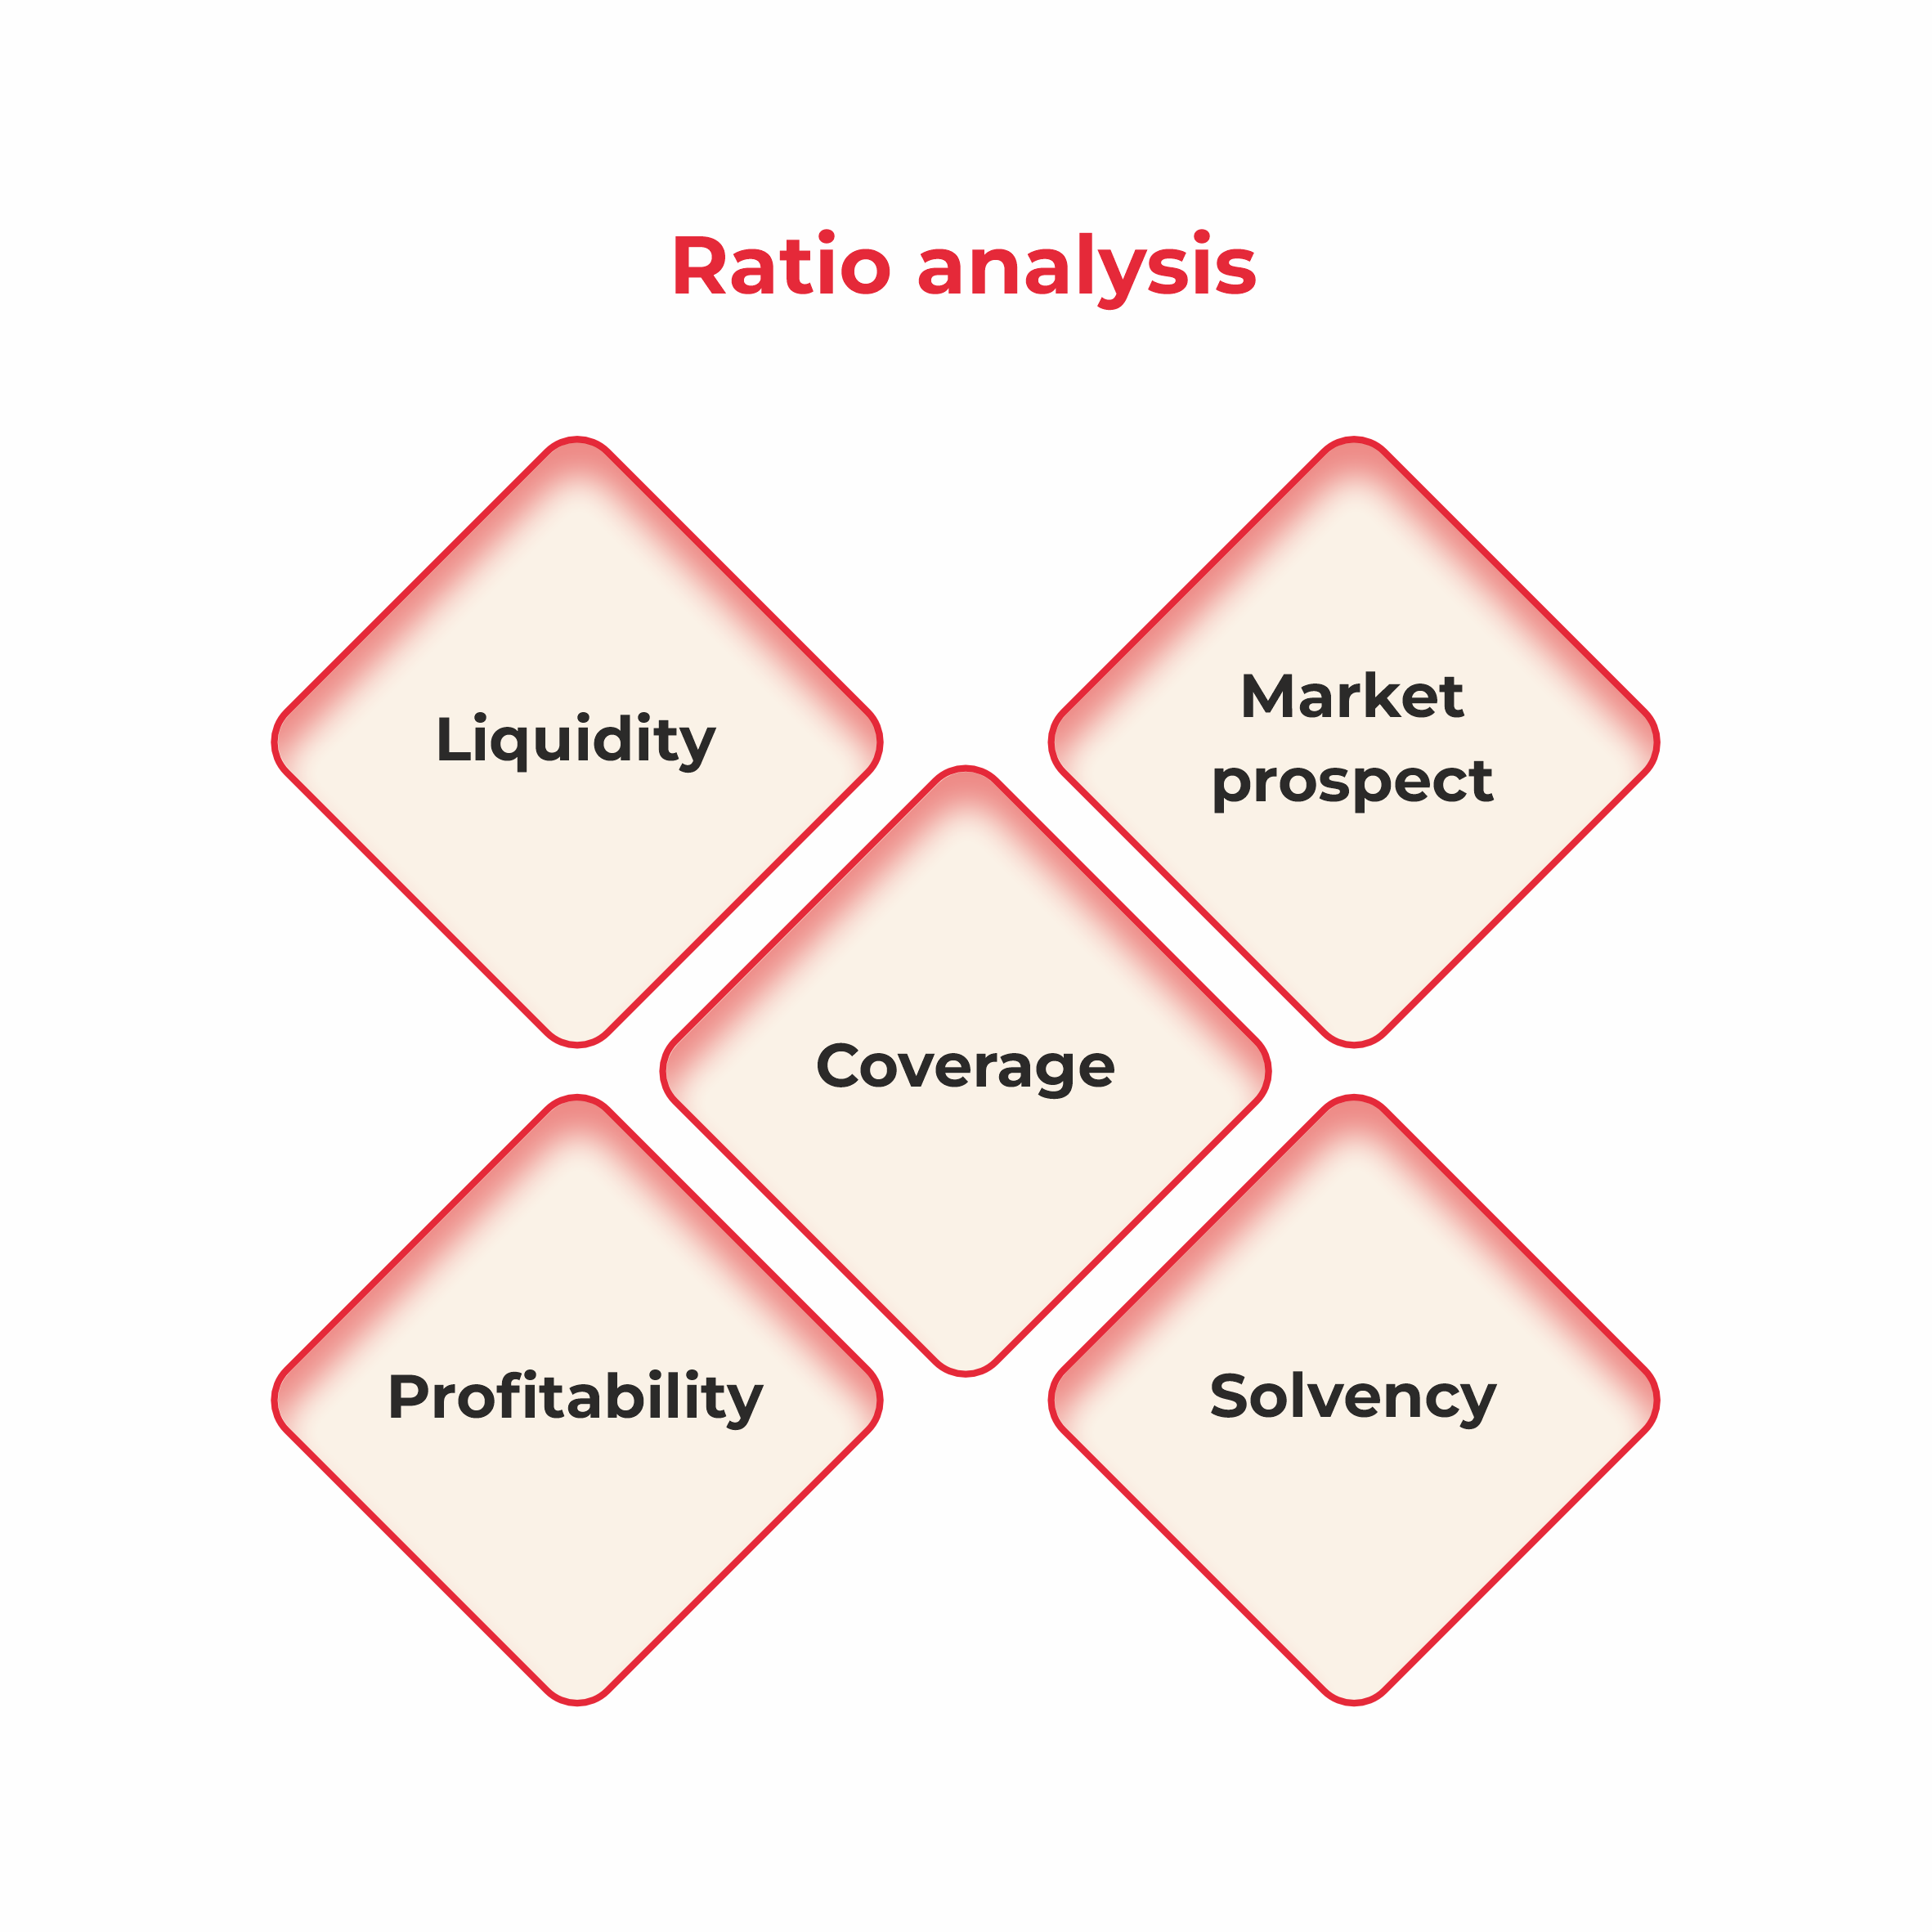
The process of financial analysis is important in a business as it gives information about its stability, solvency, liquidity, and profitability. According to the analysis, the business can further set financial policies, make strategic plans, identify projects for investment, and build long-term business plans.
There are a few skills that a person requires to become a financial analyst and to perform his task properly. Here are some of those skills;
Research skills
Analytical skills
Accounting
Auditing
Cost Optimisation
Financial Modelling and many other related skills of the field.
Yes, it is one of the professions that is a must in any company. Without a financial analyst, the company won’t be able to understand its financial condition and take preventive measures or strategies accordingly.
Once you have taken the financial analysis certification course and become a professional in the field, you have several career options. These include Finance Controller, Finance Specialist, Project Finance Manager, Specialist Financial Planning, and more. Some of the courses that help in procuring good roles in the industry include Chartered Financial Analyst (CFA), Certified Financial Planner (CFP), Chartered Public Accountant (CPA), Financial Risk Manager (FRM), and many others.
The typical duration to complete the Financial Analysis program is 6 months to 1 year. But opting for the online course can help you get educated at your own time and pace.
Yes, definitely. A professional career as a financial analyst is one of the professions that will soon escalate because of the increase in the number of businesses in India. There cannot be any successful business without a financial analyst; thus, it will always be a good career choice in India.
The estimated average salary of a Financial Analyst ranges between 2.1lakh to 8.4lakh per annum.
The businesses give the financial analysis certification utmost importance and respect as the position of financial analyst is esteemed in a company.
Internships are an integral part of this course because you must practice your skills on a beginner level before joining a big entity and offering them your service. Working as a financial analyst or other related fields has a crucial set of work that cannot be taken for granted, and this practice is essential.
Of course, not only will you excel in your career, but you will also encounter a hike in your compensation after pursuing the financial analysis course.
To increase or promote yourself in your career graph and get a salary hike as a financial analyst, you must up your skillset. Moreover, an MBA or a master’s degree in this field can help you level up.
In India, the highest pay for a financial analyst is around 10.8 lakhs per annum; abroad, the highest salary for a financial analyst is around $83,993 per annum.
Depending on your purpose, whether you want to compare your organisation’s finance with a competitor or take an internal look at your finances, there are two types of financial analysis, Horizontal Analysis & Vertical Analysis.