P Value in Statistics: What It Really Tells You and What It Doesn't
By upGrad
Updated on Nov 10, 2026 | 6 min read | 5.66K+ views
Share:

All courses
Certifications
More
By upGrad
Updated on Nov 10, 2026 | 6 min read | 5.66K+ views
Share:
Table of Contents
Quick Insights:
Ready to Start Your Data Career? Learn SQL, Python, and data visualization through real projects and build a portfolio that gets noticed. Enroll in our online data science courses today!
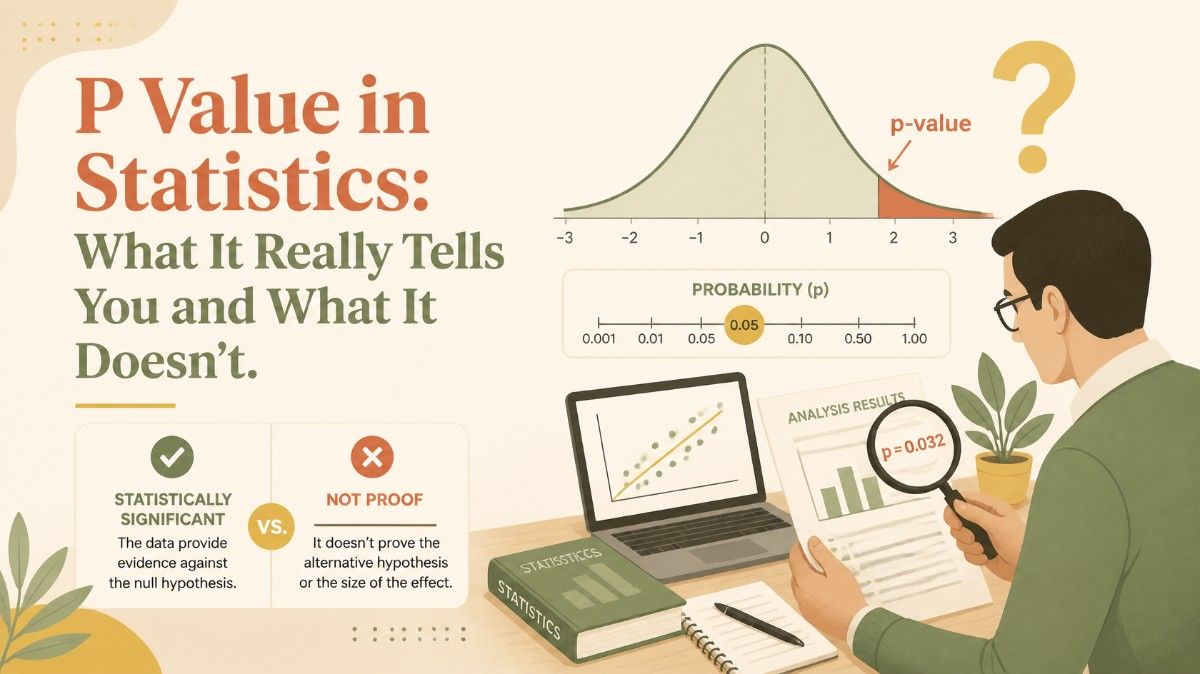
In this image you can see how p-values are represented in a probability distribution and how researchers interpret statistical results when testing a hypothesis.
Popular Data Science Programs
A p value is an important part of statistical testing. It helps researchers understand whether their results provide enough evidence against an assumption. Let's look at what it means and how it is used.
To understand p value, let's first understand,
Null hypothesis: It is the idea that the result of a study is due to chance and that there is no real effect or difference.
For example, if a study tests whether a new medicine works, the null hypothesis assumes that the medicine has no effect.
Now, a p value is a number between 0 and 1. It tells you how likely you are to get the same results, or even more unusual results, if the null hypothesis is true.
Example:
Imagine you flip a coin 10 times and get 10 heads. You suspect the coin may not be fair.
A p value shows how well your results match the null hypothesis (the assumption that there is no effect or difference).
A p value does not prove that a hypothesis is true or false. It only helps researchers understand the evidence from their data.
P value in hypothesis testing is used to check whether the results of a study provide enough evidence to reject the null hypothesis.
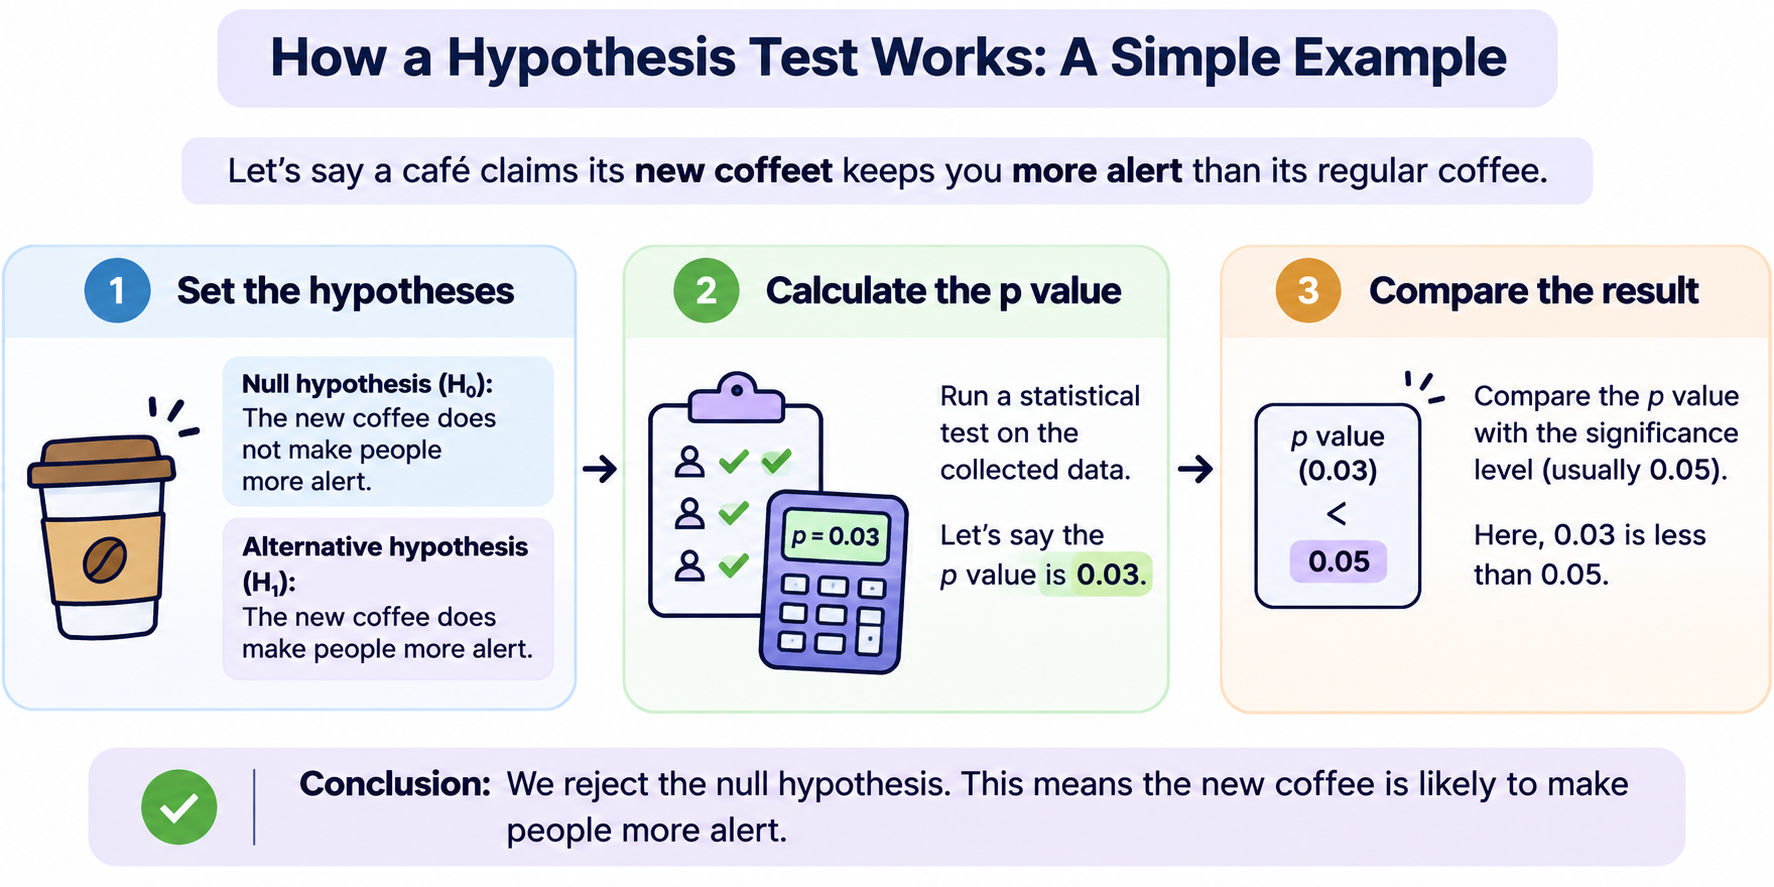
The process involves three main steps:
| Result | What It Means |
| P value below 0.05 | Reject the null hypothesis. The result is statistically significant. |
| P value above 0.05 | Fail to reject the null hypothesis. There is not enough evidence to show a significant result. |
This does not mean the null hypothesis is correct. It only means the study did not find enough evidence to reject it.
Take your data career to the next level. Earn your online M.Sc. in Artificial Intelligence and Data Science and learn skills that employers want.
Free Courses
The p value depends on the statistical test you use. It shows how unusual your results are if the null hypothesis is true.
There is no single formula for every p value. In a Z-test, researchers first calculate the Z-score and then use it to find the p value.
Know: What is T Test vs Z Test
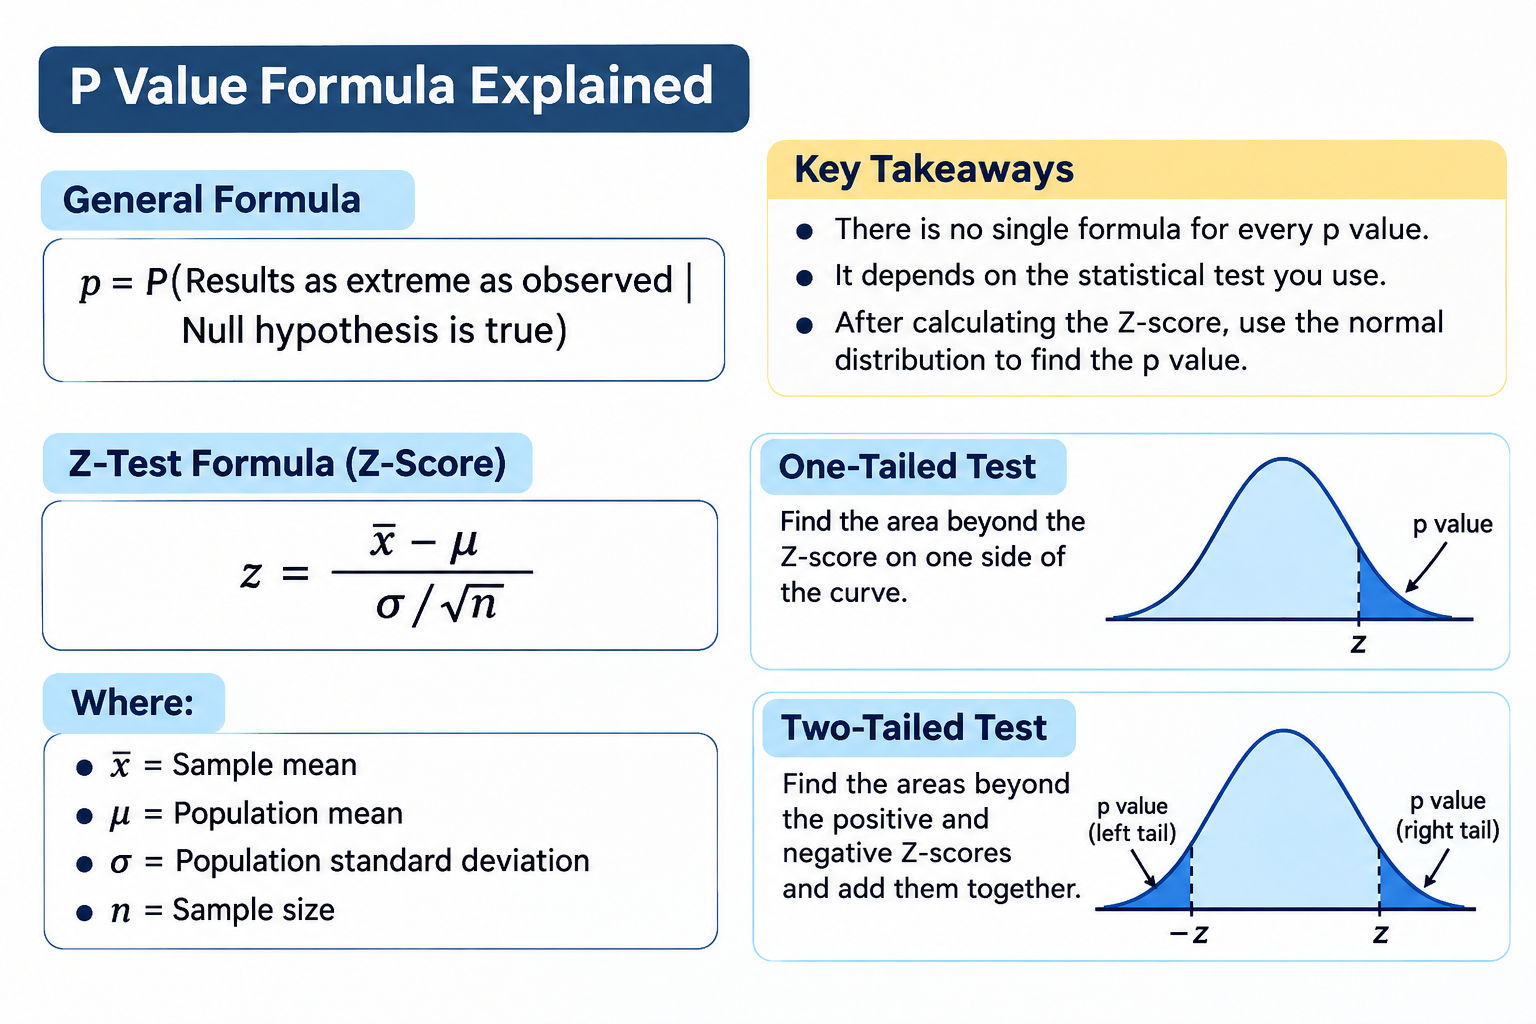
The Z-score helps researchers find the p value. The shaded areas show how p values are calculated in one-tailed and two-tailed tests.
You can find the p value using statistical tools or online calculators. The common methods include:
The method you use depends on your data and the type of test. For example, a t-test is used to compare means, while a chi-square test is used to study categorical data.
Let's understand how to calculate a p value with a simple example.
Suppose a school claims that its students score an average of 70 marks in a test. A teacher wants to check this claim by testing 36 students. The sample has an average score of 73, and the population standard deviation is 9.
The teacher uses a significance level of 0.05 to check whether the average score is different from 70.
| Step | What You Need to Do | Calculation or Explanation |
| 1. Set the hypotheses | State what you want to test. | H₀: The average score is 70. H₁: The average score is not 70. |
| 2. Choose the significance level | Set the cut-off for the test. | α = 0.05 (5%) |
| 3. Calculate the Z-score | Use the sample mean, population mean, standard deviation and sample size. | z = (73 − 70) / (9 / √36) = 3 / 1.5 = 2.00 |
| 4. Find the p value | Use the Z-score to find the probability from the normal distribution. | For z = 2.00, the two-tailed p value is approximately 0.0455. |
| 5. Compare the values | Check whether the p value is below the significance level. | 0.0455 is less than 0.05. |
| 6. Draw a conclusion | Decide what the result means. | Reject the null hypothesis. The results provide evidence that the average score is different from 70. |
Understand: Population vs Sample Difference
What does this result mean?
The p value is 0.0455, which is below the significance level of 0.05. This means the result is statistically significant. The teacher has enough evidence to reject the claim that the average score is 70.
However, this does not prove that the average score is a particular value. It only shows that the sample provides evidence of a difference.
Data Science Courses to upskill
Explore Data Science Courses for Career Progression
IIIT Bangalore
Executive Post Graduate Certificate in Data Science & AIPlacement Assistance
Once you calculate a p value, the next step is to understand what the number means. Different p values provide different levels of evidence against the null hypothesis.
A p value of 0.05 means there is a 5% chance of getting the same results, or more extreme results, if the null hypothesis is true. It is commonly used as the cut-off for deciding whether a result is statistically significant.
A p value below 0.05 means the result is statistically significant at the 5% level. It suggests that the results are unlikely under the null hypothesis, so researchers usually reject it. However, this does not prove that the finding is correct or important.
These values show different levels of evidence against the null hypothesis.
P Value |
What It Means |
| 0.01 | Stronger evidence against the null hypothesis. |
| 0.05 | Common cut-off for statistical significance. |
| 0.10 | Weaker evidence against the null hypothesis. It is usually not significant at the 0.05 level. |
Both are used in hypothesis testing, but they have different roles.
Researchers compare the two values. If the p value is equal to or below the significance level, the result is considered statistically significant.
Also Read: Types of Hypothesis
A p value is useful, but it cannot explain everything about a research result. It is important to understand its limits before drawing conclusions.
No. A low p value does not mean there is a 99% chance that your hypothesis is correct. It only shows how unusual the results would be if the null hypothesis were true. Research methods, sample quality and other factors must also be considered.
No. A p value tells you about the evidence against the null hypothesis, not the size of the difference. For example, a study may find a statistically significant improvement in test scores, but the actual increase may be very small. Researchers use effect size and confidence intervals to understand the size of a result.
Not always. A result can be statistically significant but have little practical value. For example, a new teaching method may improve average test scores by just 0.1 marks. The result may be statistically significant in a large study, but the improvement may not be useful in practice.
Dive Deeper: Introduction to Statistics and Data Analysis
P values are used in different fields to study results and check whether observed differences may be due to chance. Here are three examples.
Researchers use p values to check whether a new medicine works better than a placebo.
For example:
Companies use p values to compare marketing campaigns and find out which one gets better results.
For example:
Students and researchers use p values to understand the results of their studies.
For example:
Conclusion
To understand the findings better, use p values along with effect sizes, confidence intervals and careful judgement.
Do you need help to learn more about statistics and data? Schedule a free consultation with our experts today to explore courses and have good career guidance!
More Helpful Reads:
P stands for probability. A p value shows the chance of getting the same results, or even more extreme results, if the null hypothesis is true.
A p value tells you how unusual your results are if the null hypothesis is true. A smaller p value means the results provide stronger evidence against that assumption.
A p value of 0.05 means there is a 5% chance of getting results this extreme, or more extreme, if the null hypothesis is true. It is a commonly used cut-off for statistical significance.
A p value below 0.05 usually means the result is statistically significant at the 5% level. It suggests that the data provides enough evidence to reject the null hypothesis.
First, choose the right statistical test for your data. Then calculate the test statistic and use it to find the p value. You can do this using statistical software, online calculators or statistical tables.
There is no single formula for every p value. The calculation depends on the statistical test you use. In simple terms, a p value is the probability of getting results as extreme as yours, or more extreme, if the null hypothesis is true.
You can find a p value using tools such as Excel, SPSS, R or Python. You can also use online calculators or statistical tables. The method depends on the type of test and your data.
Neither is always better. A significance level of 0.01 is stricter, so it requires stronger evidence before rejecting the null hypothesis. A level of 0.05 is more commonly used. The right choice depends on the study and the risk of making a wrong decision.
The significance level is the cut-off chosen before a study begins. The p value is calculated after analysing the data. Researchers compare the two to decide whether the result is statistically significant.
No. A p value is a probability, so it always falls between 0 and 1. For example, a p value of 0.20 means a 20% probability of getting results this extreme, or more extreme, if the null hypothesis is true.
No. A low p value does not prove that a hypothesis is correct. It only shows that the results would be unusual if the null hypothesis were true. Researchers must consider other evidence before drawing a conclusion.
A p value helps researchers understand whether their results provide enough evidence against the null hypothesis. They compare it with a chosen significance level, such as 0.05, to decide whether to reject the null hypothesis.
1350 articles published
We are an online education platform providing industry-relevant programs for professionals, designed and delivered in collaboration with world-class faculty and businesses. Merging the latest technolo...
Speak with Data Science Expert
By submitting, I accept the T&C and
Privacy Policy
Start Your Career in Data Science Today
Top Resources
Executive Diploma
12 Months
Master's Degree
18 Months
Bootcamp
6 Months