What Does a Data Analyst Do? Job Description, Skills and Salary
By upGrad
Updated on Oct 22, 2026 | 13 min read | 3.86K+ views
Share:

All courses
Certifications
More
By upGrad
Updated on Oct 22, 2026 | 13 min read | 3.86K+ views
Share:
Table of Contents
A data analyst collects, cleans and interprets data to help a business make decisions. The job involves writing SQL queries, building reports and dashboards in Excel, Power BI or Tableau, and presenting trends to managers. Entry roles usually ask for a bachelor's degree, strong spreadsheet and SQL skills, and basic statistics.
Quick Insights
If you're aiming to become a Data Analyst, enrolling in a Data Science Course can help you to build foundational skills in data analysis and programming. You can learn key skills like analysing data, building models, working with machine learning, and making sense of complex datasets.
Popular Data Science Programs
A data analyst helps businesses understand what their data reveals about customers, performance and daily operations. They collect information from different sources, check its accuracy and analyse it to find patterns that can support business decisions.
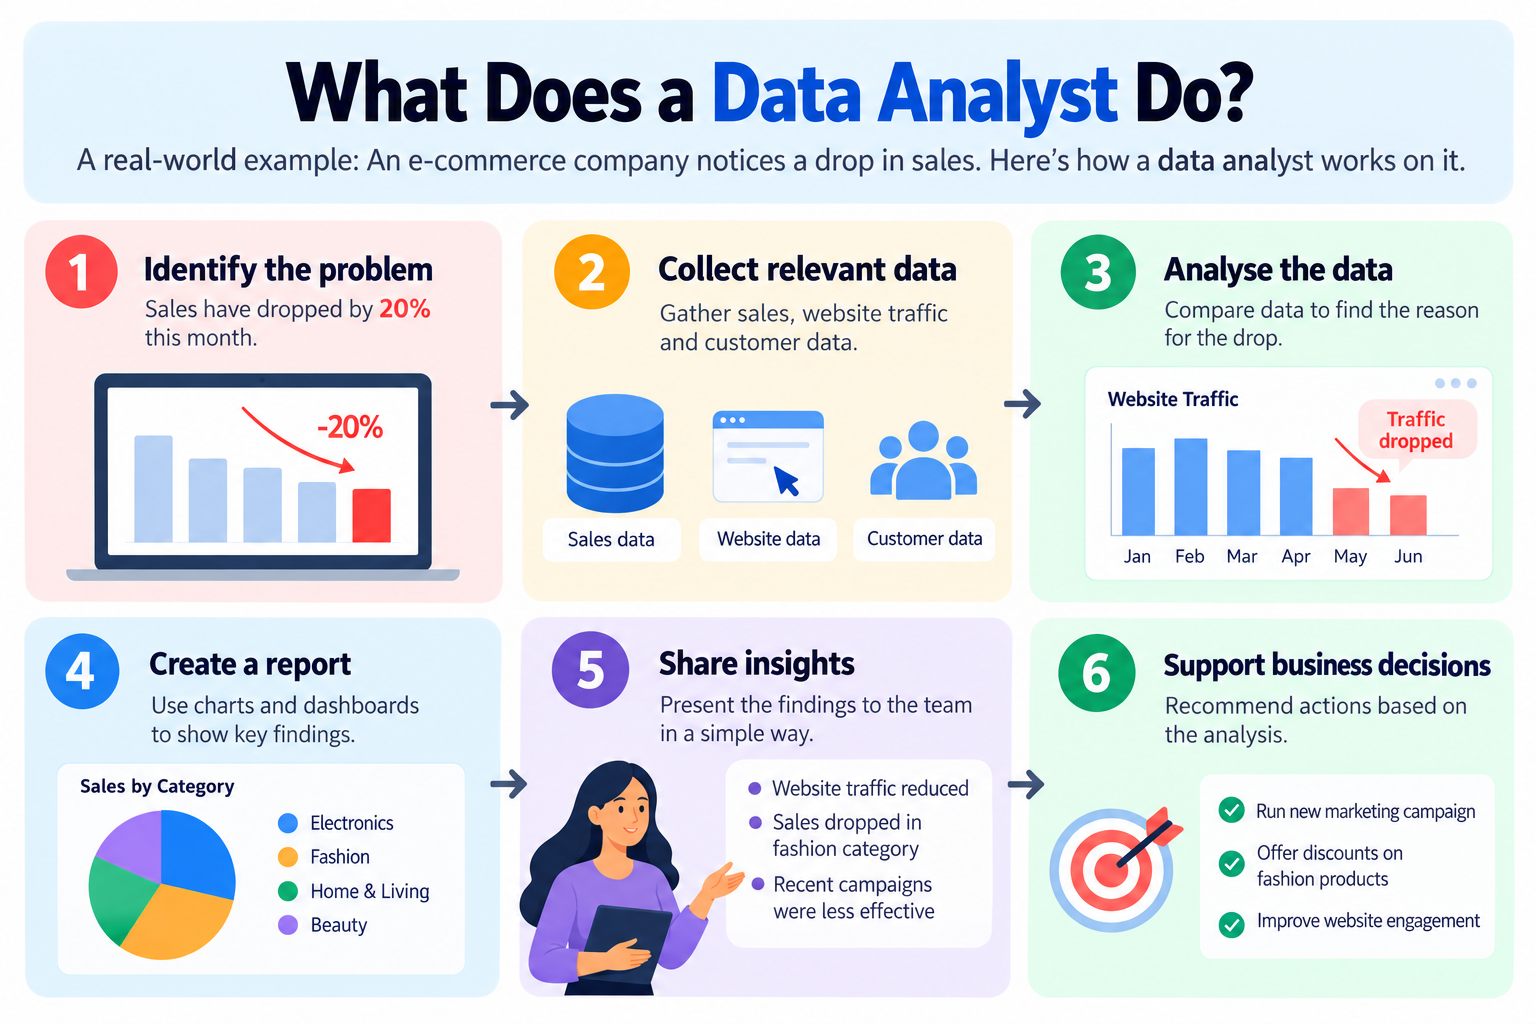
The main responsibilities of a data analyst include the following.
Data analysts gather information from databases, spreadsheets, surveys and other sources. They organise and clean this information before analysing it.
Data analysts examine datasets to identify patterns, trends and changes. They use statistical methods to understand what the data reveals and answer specific business questions.
Learn: What Is Data Interpretation?
Data analysts present their findings in a format that is easy to understand. They use charts, graphs and dashboards to explain important results to managers and other teams.
Data analysts check whether information is accurate, complete and consistent before using it for analysis.
Data analysts work with teams to understand business performance and identify areas for improvement. Their findings help managers assess results and plan their next steps.
Data analysts often work with departments such as marketing, finance, sales and operations. They discuss business requirements, understand what information each team needs and share relevant findings.
After analysing the data, analysts explain what the results may mean for the business. They may suggest ways to improve customer experience, reduce costs or track performance more effectively.
Their recommendations help teams evaluate options before making decisions.
Data analysts need to keep their technical knowledge up to date as tools and business requirements change. They can improve their skills by practising with new datasets, learning software and exploring relevant data science courses and certifications.
Earn certifications from PwC Academy, NSDC, and upGrad with Professional Certificate Program in Data Science and AI, designed by AI & ML leaders from Paytm, Gramener and Zalando and Build Real-World Projects on Snapdeal, Uber, Sportskeeda, and more
Free Courses
Data analysts use different tools to collect, organise, analyse and present data. The tools they need depend on their job responsibilities, the size of the datasets and the type of analysis they perform. Excel, SQL, Python and Power BI are useful tools for many data analyst roles.
| Tool | Used For | Level Needed |
| Excel | Organising data, performing calculations, using formulas and creating charts and reports. | Beginner to intermediate |
| SQL | Retrieving, filtering and managing data stored in databases. | Beginner to intermediate |
| Python | Cleaning datasets, automating tasks, performing statistical analysis and building models. | Beginner to intermediate, with advanced skills for specialised roles |
| Power BI | Creating interactive dashboards, visualising data and sharing business reports. | Beginner to intermediate |
| Tableau | Creating interactive charts, dashboards and visual reports. | Beginner to intermediate |
| R | Performing statistical analysis, building statistical models and creating visualisations. | Beginner to intermediate, depending on the role |
| Google Analytics | Tracking website traffic, user behaviour and digital marketing performance. | Beginner to intermediate for analytics roles |
| Git | Tracking code changes and collaborating on data analysis projects. | Basic knowledge is useful |
| SAS | Performing statistical analysis, managing data and generating reports, particularly in specialised industries. | Depends on the role |
Also Learn: Why Should You Learn R for Data Science?
Data Science Courses to upskill
Explore Data Science Courses for Career Progression
IIIT Bangalore
Executive Post Graduate Certificate in Data Science & AIPlacement Assistance
Data analysts, business analysts and data scientists help organisations make better decisions, but they focus on different problems. Data analysts study data to identify trends, business analysts look for ways to improve business processes, and data scientists use statistical methods and machine learning to build predictive models.
| Basis of Comparison | Data Analyst | Business Analyst | Data Scientist |
| Focus | Analyses data to identify trends, measure performance and support decisions. | Studies business needs, identifies problems and recommends process improvements. | Uses data, statistics and machine learning to build predictive models and solve complex problems. |
| Tools | Excel, SQL, Power BI, Tableau and Python. | Excel, Jira, business intelligence tools and process-mapping software. | Python, SQL, machine learning libraries and statistical tools. |
| Typical Background | Statistics, mathematics, economics, computer science or data analytics. | Business administration, management, information technology or a related field. | Data science, computer science, statistics, mathematics or a related field. |
If you want to explore the data science career path further, read our guide on what a data scientist does. You can also explore data science courses and certifications to learn about the skills used in this field.
Data analysts can work in different fields based on their interests and skills. Some focus on business performance, finance, marketing, or cybersecurity. Others use data to understand past results and predict future trends.
Business analysts study a company's operations and performance to find ways to improve them. They use data to help teams make better decisions and connect business needs with technical solutions.
Risk analysts study data to identify possible risks that could affect a business. They help companies understand financial, operational, and security risks and find ways to reduce potential losses.
You can learn more about SQL using this SQL tutorial.
Financial analysts study financial records, budgets, and market trends. They help businesses make decisions about spending, investments, and future financial plans.
Data scientists work with large and complex datasets to find patterns and solve problems. They also use advanced methods, such as machine learning, to build models and predict possible outcomes.
You can get started with this Python tutorial.
Marketing analysts study customer behaviour, campaign performance, and market trends. They use this information to improve marketing campaigns, reach the right audience, and make better use of marketing budgets.
Cybersecurity analysts study network activity, system logs, and security weaknesses to identify possible threats. They help protect a company's systems and digital information from cyberattacks.
Operations analysts study data related to a company's daily activities, workflows, and resources. They identify problems and suggest ways to improve efficiency, reduce delays, and manage resources better.
Product analysts study how customers use a product, such as a website, mobile app, or software platform. They use this information to identify problems, understand user needs, and suggest product improvements.
Prescriptive analytics helps businesses decide what action to take in a particular situation. It uses data, predictions, and simulations to compare possible actions and suggest a suitable option.
Diagnostic analytics helps data analysts understand why something happened. They examine data from different sources to find patterns, connections, and possible causes behind a result.
Descriptive analytics summarises past data to show what has happened over a period. Businesses use it to track performance and understand trends.
Read More: Predictive Analytics vs Descriptive Analytics
Predictive analytics uses historical data, patterns, and statistical models to estimate what might happen in the future. Some predictive methods also use machine learning to improve forecasts.
Data analysts work across industries such as technology, banking, consulting, retail, and e-commerce. Their salaries vary based on experience, technical skills, job responsibilities, and the company they work for.
The table below shows the average annual salaries listed for data analysts at some of the top companies in India.
| Company | Average Salary per Year |
| Apple | ₹11.4 Lakhs |
| Microsoft | ₹19.1 Lakhs |
| Meta (Facebook) | ₹16.2 Lakhs |
| ₹15 Lakhs | |
| Accenture | ₹7.7 Lakhs |
| TCS | ₹5.7 Lakhs |
| Cognizant | ₹6.7 Lakhs |
| Wipro | ₹5.2 Lakhs |
| Capgemini | ₹5.5 Lakhs |
| S&P Global | ₹6.1 Lakhs |
| Infosys | ₹4.9 Lakhs |
| Tech Mahindra | ₹5.4 Lakhs |
| Deloitte | ₹8.1 Lakhs |
| HCLTech | ₹4.9 Lakhs |
| Amazon | ₹7.5 Lakhs |
| Flipkart | ₹6.5 Lakhs |
| Genpact | ₹6.1 Lakhs |
| Ernst & Young | ₹7.7 Lakhs |
| IBM | ₹8.1 Lakhs |
| LTIMindtree | ₹6 Lakhs |
Source: AmbitionBox.
Also read: Data Analyst Salary in India: For Freshers and Experienced Professionals
Subscribe to upGrad's Newsletter
Join thousands of learners who receive useful tips
You can start a career in data analytics by learning essential tools, building practical skills, and applying for entry-level roles. Follow these steps to prepare for your first data analyst job.
Start with Excel, SQL, and basic statistics. Then learn a data visualisation tool such as Power BI or Tableau. You can learn Python later to analyse larger datasets.
Practise writing queries to filter, sort, group, and combine data. Solve practical problems and prepare using these common SQL interview questions.
Create two or three projects using public datasets. For example, analyse sales trends, study customer behaviour, or build a Power BI dashboard. Explain your findings and share your projects on GitHub.
A data analytics certificate can help you learn key concepts and tools. Choose a course with practical assignments and projects. You can explore relevant data science courses and certifications.
Look for positions such as Junior Data Analyst, Data Analyst Intern, Reporting Analyst, and MIS Executive. Highlight your technical skills, projects, and certifications in your resume.
Practise SQL, Excel, and basic statistics questions. Be ready to explain your projects, the insights you found, and how businesses can use those insights.
The demand for data analysts is growing as businesses use data to make better decisions. AI and machine learning are also changing how analysts collect, study, and interpret data.
Here are some key trends shaping the future of data analytics:
To grow in this field, keep practising with real datasets, learn new tools, and improve your ability to explain data insights clearly.
You can also book your free personalized career counseling session today and take the first step toward transforming your future.
Similar Reads:
A data analyst collects, cleans, and analyses data to identify trends and solve business problems. Their key responsibilities include preparing reports, creating dashboards, checking data accuracy, and sharing insights to support business decisions.
Data analysts need technical skills such as Excel, SQL, basic statistics, and data visualisation. Python or R can help with more advanced analysis. Communication and problem-solving skills are also important for explaining findings clearly.
A data analyst studies data to understand patterns, track performance, and answer business questions. For example, they may analyse sales figures to understand why revenue has dropped and share their findings with the management team.
A data analyst focuses on studying data to identify trends and insights. A business analyst focuses on understanding business needs, reviewing processes, and recommending improvements. Both roles can work together to solve business problems.
Yes, freshers can apply for entry-level data analyst jobs in India. Learning Excel and SQL, building a few practical projects, and preparing for technical interviews can improve their chances. Relevant job titles include Junior Data Analyst, Data Analyst Intern, and Reporting Analyst.
Many employers prefer a bachelor's degree in mathematics, statistics, computer science, economics, or a related field. However, requirements vary by company, and practical skills, projects, and relevant certifications can strengthen an application.
Data analysts work in banking, finance, healthcare, retail, e-commerce, technology, education, marketing, and manufacturing. These industries use data to understand customer behaviour, track performance, manage operations, and make better decisions.
A data analyst studies existing data to understand trends and answer business questions. A data scientist often uses advanced statistics and machine learning to build models and predict future outcomes. Their responsibilities may overlap depending on the organisation.
Common tools include Excel, SQL, Python, R, Power BI, and Tableau. Excel and SQL are useful starting points, while Python and visualisation tools help with more advanced analysis and reporting.
Data analyst salaries in India depend on experience, skills, location, and employer. Freshers typically earn less than experienced professionals, while specialised and senior roles may offer higher salaries.
Yes, certifications such as the Google Data Analytics Professional Certificate, IBM Data Analyst Professional Certificate, and relevant Microsoft Power BI certifications can help learners develop practical skills. Choose a course that matches your career goals and includes hands-on exercises.
Data analysts can progress to roles such as Senior Data Analyst, Business Intelligence Analyst, or Analytics Manager. With additional training and experience, they may also move into data science or senior data leadership roles.
Data analysis can be a good career choice for people who enjoy solving problems, working with data, and identifying patterns. It offers opportunities across different industries, but career growth depends on practical skills, experience, and continuous learning.
1283 articles published
We are an online education platform providing industry-relevant programs for professionals, designed and delivered in collaboration with world-class faculty and businesses. Merging the latest technolo...
Speak with Data Science Expert
By submitting, I accept the T&C and
Privacy Policy
Start Your Career in Data Science Today
Top Resources
Executive Diploma
12 Months
Master's Degree
18 Months
Bootcamp
6 Months