What is Data Analysis? Types, Process, Methods and Examples
By upGrad
Updated on Oct 08, 2026 | 6 min read | 2K+ views
Share:

All courses
Certifications
More
By upGrad
Updated on Oct 08, 2026 | 6 min read | 2K+ views
Share:
Key Points:
Want to learn data at expert level? Then explore our top Data Science courses and learn best demanding skills in SQL, Python, Power BI, and data visualization to start your data powered career.
Popular Data Science Programs
Every small to small companies and businesses has data, but only data is not very useful. Data analysis help people to understand information, solve problems and make better decision. Using data analysis in work reduce risks, improve performance, and create growth.
Key Objectives of Data Analysis:
Free Courses
Data analysis can be classified in a number of ways depending upon the purpose of the query. Different types of data analysis enable the organizations to analyze their past experiences, find solutions behind the solutions and predict future outcomes
Descriptive analysis helps to understand historical information.
How It Is Used:
Advantages:
Diagnostic analysis helps to determine the underlying reasons for a particular incident.
How It Is Used:
Advantages:
Predictive analysis helps to predict future outcomes on the basis of past occurrences.
How It Is Used:
Advantages:
Prescriptive analysis defines appropriate recommendations and responses for solving a query.
How It Is Used:
Advantages:
Data Science Courses to upskill
Explore Data Science Courses for Career Progression
IIIT Bangalore
Executive Post Graduate Certificate in Data Science & AIPlacement Assistance
The ability to analyze data generally depends on the tools & techniques used in the overall process. Tools help companies to organize, manage, and analyze data, whereas techniques help to find patterns, solve problems, and identify areas of interest.
Tools and techniques are very important in helping organizations turn data into information which will be used to make decisions for growth.
| Tool | Usage |
| Excel | Data organization and reporting |
| Python | Data analysis and automation |
| R | Statistical analysis |
| Tableau | Data visualization |
| Power BI | Dashboards and reporting |
| SQL | Database management |
| SAS | Advanced analytics |
| KNIME | Data mining and ML |
Technique |
Usage |
| Data Cleaning | Fixes data errors |
| Data Visualization | Creates charts and graphs |
| Descriptive Analysis | Shows what happened |
| Diagnostic Analysis | Explains why it happened |
| Predictive Analysis | Predicts future outcomes |
| Prescriptive Analysis | Recommends actions |
| Regression Analysis | Finds relationships in data |
| Cluster Analysis | Groups similar data |
| Time Series Analysis | Tracks trends over time |
| A/B Testing | Compares two options |
| Data Mining | Finds hidden patterns |
| Machine Learning | Makes predictions automatically |
Techniques of data analysis can help people in understanding data as well as answering various questions. Data analysis methods are used to understand past, techniques for explaining the cause and effect, predict the future and give recommended suggestions.
Descriptive analysis summarizes data to show companies about what is happened.
Usage:
Diagnostic analysis helps to identify why something is happened.
Usage:
Exploratory analysis checks data to find patterns, trends, and relationships.
Usage:
Inferential analysis uses raw data to make results about a larger group.
Usage:
Predictive analysis uses previous data to predict future results.
Usage:
Prescriptive analysis recommends the best move to take based on the data understanding.
Usage:
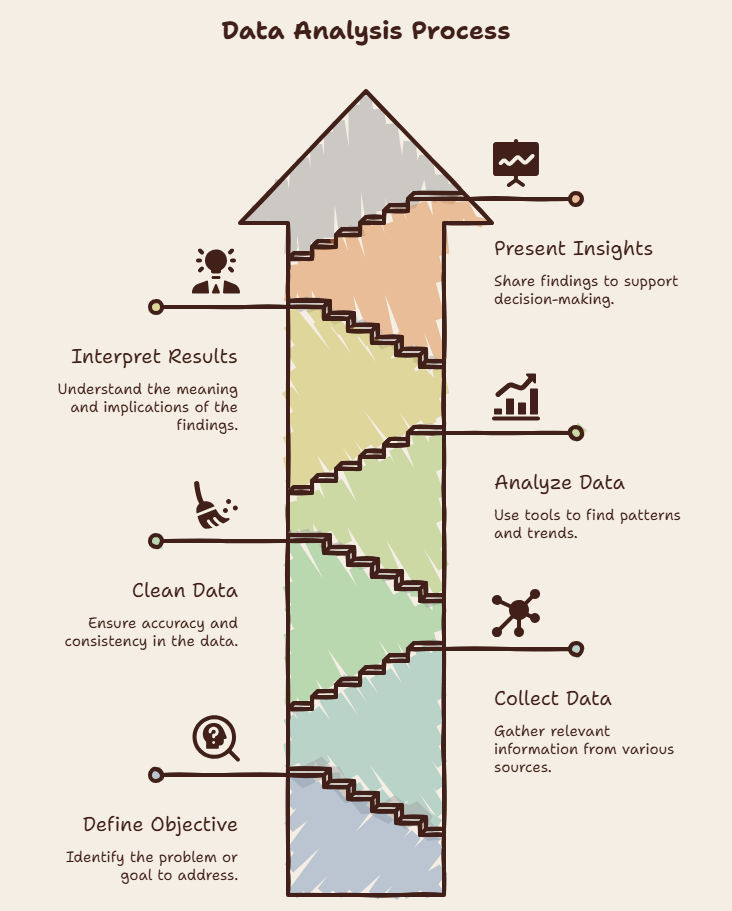
The data analysis process is a procedure through which data is collected, organized, analyzed and interpreted for effective decision making. This process helps firms to generate useful information from the available data.
Many people think that data analysis and data analytics are the same thing, but there is a difference. Data analysis focuses on examining data to answer some specific question, while data analytics is a bigger process which includes collecting, managing, analyzing, and using data to make better decisions.
Here are the major differences of data analysis and data analytics:
| Data Analysis | Data Analytics |
| Focuses on examining data | Focuses on the complete data process |
| Answers a specific question | Supports overall business decisions |
| Looks at existing data | Works with past and current data |
| Identifies patterns and insights | Uses insights to improve outcomes |
| A smaller part of the process | A broader field that includes data analysis |
| Helps understand what happened | Helps understand, predict, and optimize results |
| Often used for reports and research | Often used for business strategy and planning |
| Main goal is finding insights | Main goal is driving data-driven decisions |
Explore More: Difference between Data Analysis and Data Analytics
Data analysis can be very helpful in assisting companies making better business decisions. This can be done by interpreting and evaluating data and using it to support the decision-making process instead of relying on guessing.
Example 1: How Netflix Uses Data Analysis to Recommend Movies and TV Shows
Example 2: How Suzuki Uses Data Analysis to Transform Cars Into Better Performing and Safer Vehicles
Example 3: How Starbucks Uses Data Analysis to Help Make Better Decisions About Where to Place Its Stores
Data analysis helps people and companies to make better decisions through knowledge gained from data. However, just like other processes, there are some advantages and disadvantages with data analysis as well, which helps to use data in a better way.
Advantages and Disadvantages of Data Analysis:
Advantages |
Disadvantages |
| Supports better decision-making | Requires high-quality data |
| Helps identify trends and patterns | Can be time-consuming |
| Improves business performance | May require skilled professionals |
| Reduces risks and uncertainties | Errors can lead to incorrect insights |
| Enhances customer understanding | Large datasets can be difficult to manage |
| Helps predict future outcomes | Data privacy and security concerns |
| Increases efficiency and productivity | Analysis tools can be costly |
| Supports data-driven business growth | Results can be misinterpreted |
Conclusion
So, what is data analysis? Data analysis is the process of transforming raw data into valuable information that will help people, scientists, and organizations make effective decisions. Using descriptive, diagnostic, predictive, and prescriptive methods, data analysis is solving problems, finding trends, and enhancing performance of all businesses.
With the rising usage of data, this skill is increasingly gaining importance in the modern world.
If you want to develop skills in this highly demanding field, contact our experts for a free consultation on how you can start a career in this field.
Exploratory Data Analysis (EDA) includes interactively examining data to uncover noteworthy or intriguing aspects of a given data set. Additionally, it involves surveying and assessing data on hand to determine what is going on in the data.
The principal objective of data analysis is to extract information from raw data that may be utilized to enhance business decision making. Also, data analysis facilitates the discovery of trends and patterns, addressing business problems, reducing hazards and risks, and ultimately enhancing decision-making capabilities, which provides organizations with competitive advantages over others.
Cluster analysis is a method used in data mining to classify sets of data that have not been classified in segments. Cluster analysis helps businesses identify buying patterns among their clients and, therefore, understand their customers’ behaviors. Many companies use the power of cluster analysis to categorize their customers based on shopping behaviors.
Clustering analysis is used to classify a large amount of data into a reduced amount of clusters. A cluster is a set of similar data points that is different from data points in other clusters. Clustering analysis is essential in recommendation systems in the identification of similar items and, hence, it is used in business analysis, research, and development.
Data analysis in research process includes the method to understand the information derived from a study or experiment to identify patterns in the data that correspond to the study’s research objectives. In research, statistical data analysis techniques are applied to enhance the precision of research results.
Data analysis is the process of examining raw data to find useful information. Data interpretation is the process of understanding and explaining what those insights mean. In easier terms, data analysis finds the results, while data interpretation explains the results and their significance.
The term data analysis refers to the investigation method of ascertaining relevant information by evaluating data sets to extract adequate information that aids the decision-making process. Therefore, data analysis involves collecting, processing, organizing, and evaluating data to respond to research questions.
Descriptive statistics is a term that describes statistical analysis used in data analysis to summarize statistics for a given data set. Additionally, it is a form of data analysis that helps in describing, explaining, and summarizing essential trends and patterns in a given set of data.
The following are the best tools for data analysis:
A general data analysis process follows sequential stages that include the formulation of objectives and creation of theory. Thereafter, the second procedure includes gathering and evaluating data, analyzing and interpreting the results to gain knowledge. The last procedure is presenting the outcomes in visual or diagrammatic formats.
Some of the various career opportunities for individuals with data analysis skills include:
1015 articles published
We are an online education platform providing industry-relevant programs for professionals, designed and delivered in collaboration with world-class faculty and businesses. Merging the latest technolo...
Speak with Data Science Expert
By submitting, I accept the T&C and
Privacy Policy
Start Your Career in Data Science Today
Top Resources
Executive Diploma
12 Months
Master's Degree
18 Months
Bootcamp
6 Months