Financial Statement Analysis: Methods, Types, Ratios, and Examples
By upGrad
Updated on Aug 04, 2026 | 10 min read | 2.16K+ views
Share:

All courses
Certifications
More
By upGrad
Updated on Aug 04, 2026 | 10 min read | 2.16K+ views
Share:
Table of Contents
Advance your career with upGrad's Management Courses and gain industry-relevant skills, expert mentorship, and global recognition. Enroll today!
Popular Management Programs
The meaning of financial statement analysis is that it investigates the financial health of a company. It is a process of looking at a company's statements to see how well the company is doing. It helps stakeholders understand the company's position, how well the company is operating, if it is profiting, if the company has enough money to pay its bills, and if the company will be stable in the long term.
Instead of just reading the company's financial reports, it is the analysis and interpretation of financial statements of a company over different time periods.
If the financial statement analysis is well-performed, it helps the company understand the status of a company and what the company needs to do to grow in the future.
The main objectives of financial statement analysis and interpretation of financial statements are:
If a company analyzes its reports regularly, the people who manage the company can make decisions based on facts instead of just guessing.
Businesses analyze financial statements to:
These three reports Financial Statements will give a complete picture of the company's financial situation.
Financial statement analysis mainly focuses on three financial reports:
Free Courses
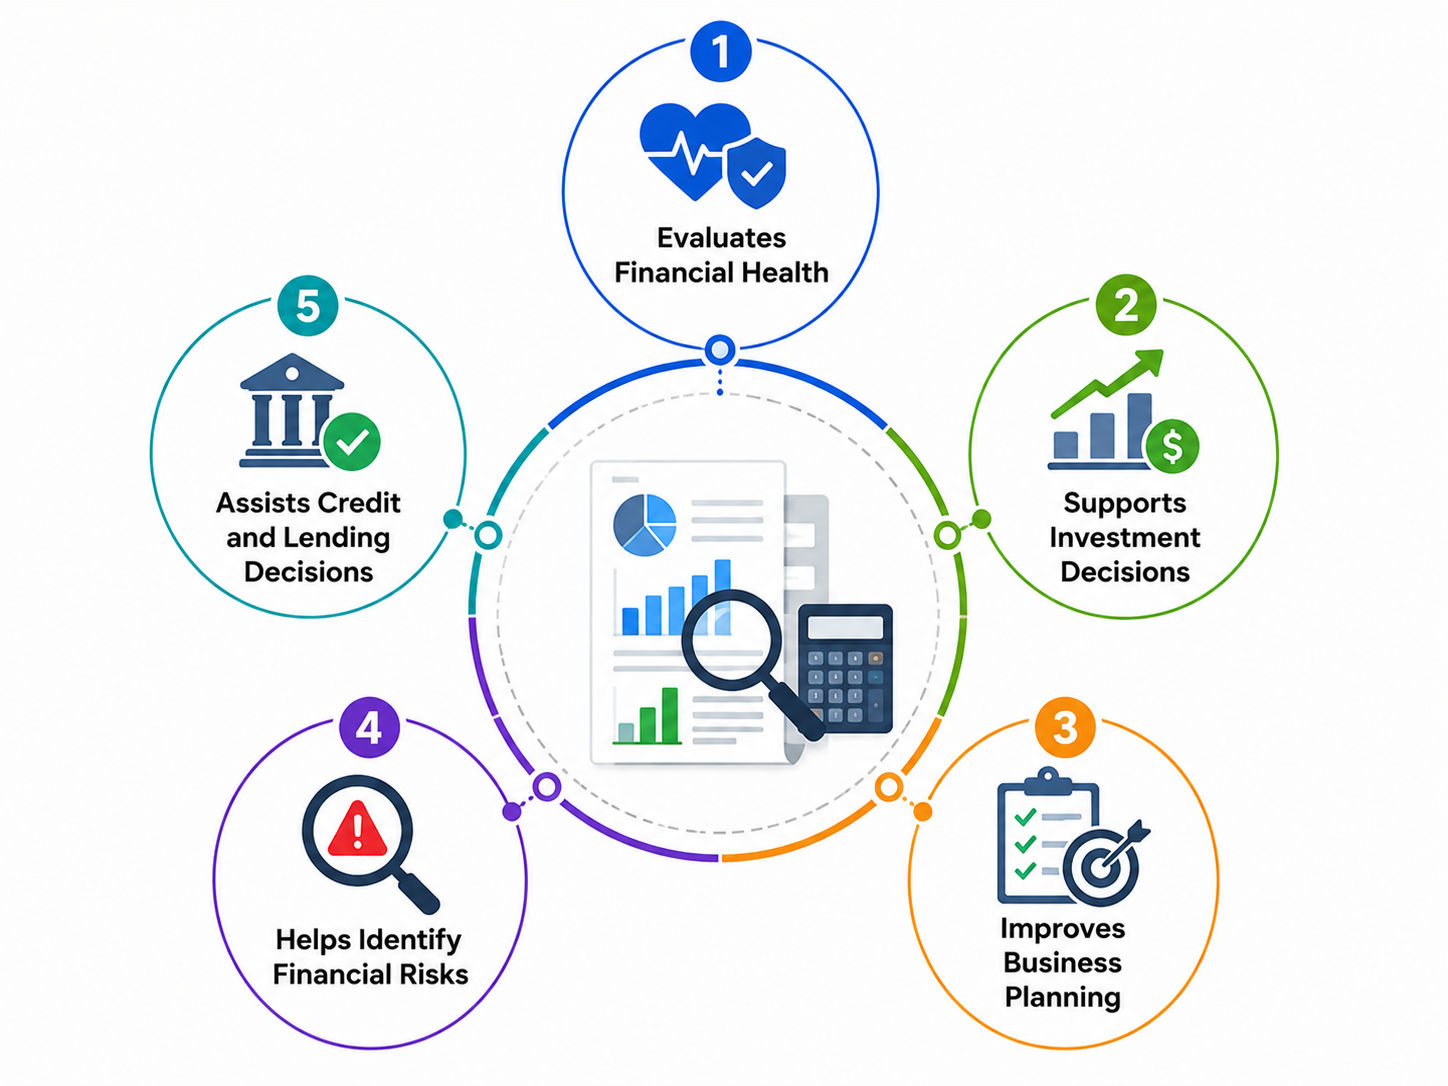
Financial statement analysis is really important because it collects a lot of data and turns it into information that we can actually use. It helps companies and the people who have a stake in them figure out how well they are doing, if they are making money and if they are ready for what's coming next.
Evaluating financial health helps us determine whether the business is financially stable and capable of sustaining long-term growth. Financial statement analysis gives us an idea of how a company is doing financially by looking at things like:
Example:
If a company is making more profit every year and has less due, that is usually a good sign that its financial health is getting better.
People who invest in companies use financial statement analysis to decide if a company is an investment. By looking at financial ratios and how they have done in the past, investors can find companies that are likely to do well and are not too risky.
Key questions investors ask include:
Having a good understanding of the financial situation helps companies use their resources more efficiently and make more money.
Managers use analysis to make big decisions about things like:
Early identification of these problems of the company can do something to take corrective action. Financial statement analysis helps us find problems before they become issues.
Examples include:
Banks and lenders look at statements before they decide to give a company a loan or credit. If a company is financially healthy, it is more likely to get a deal on a loan.
They assess factors such as:
Management Courses to upskill
Explore Management Courses for Career Progression
IIIT-B & IIM, Udaipur
Chief Technology Officer & AI Leadership Programme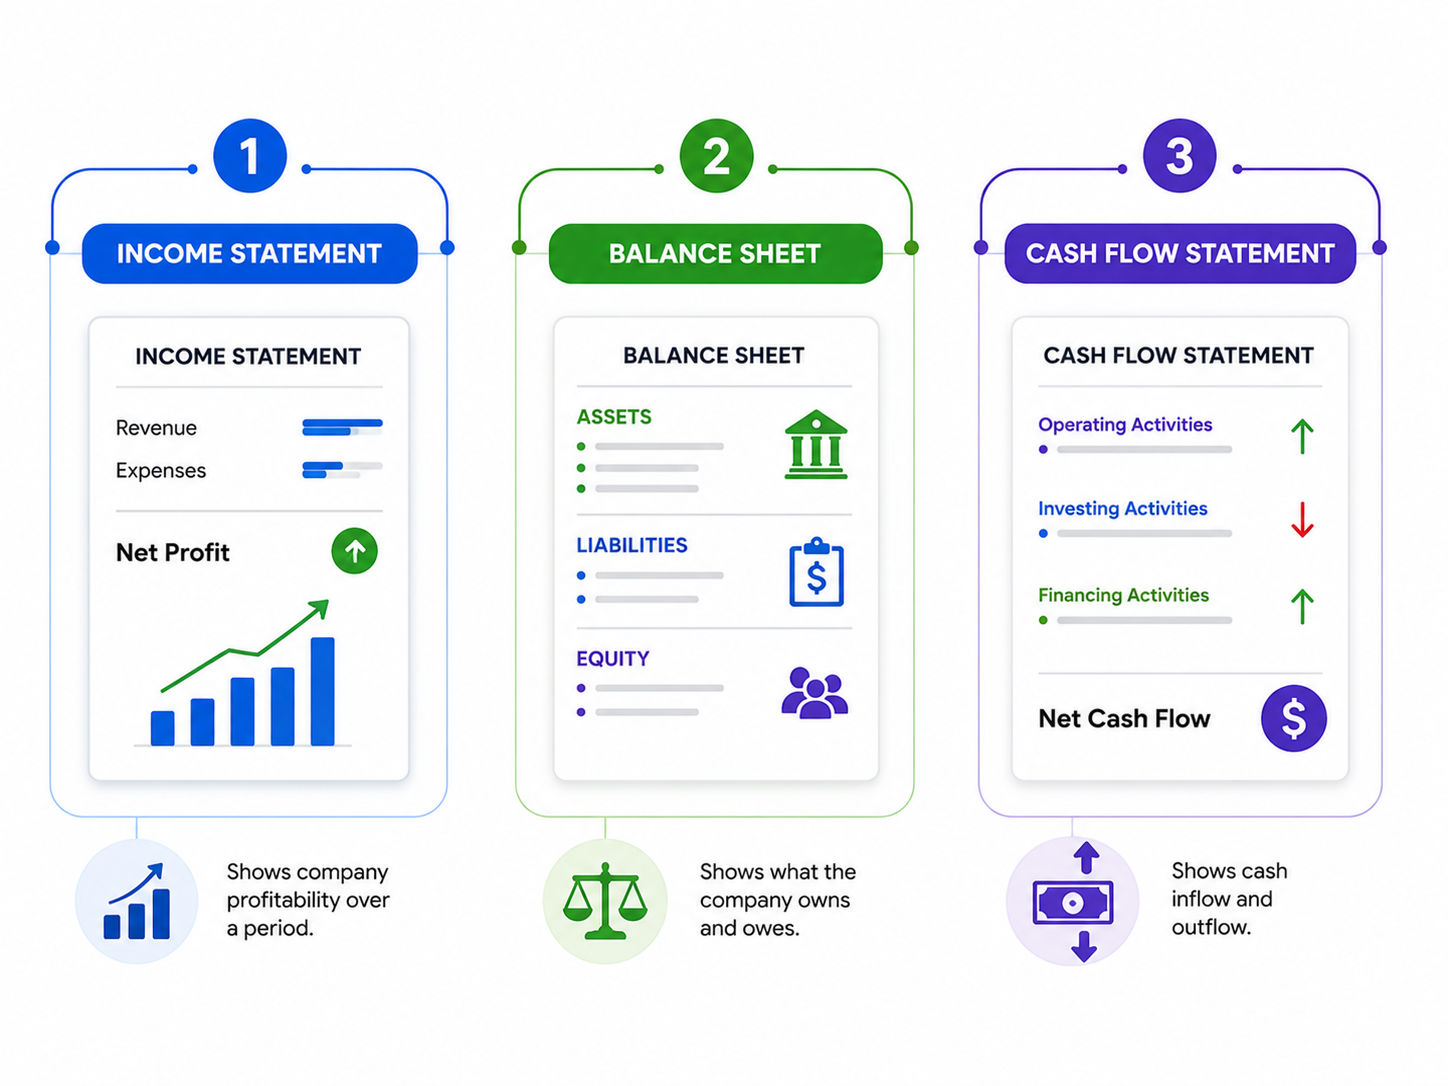
Financial statement analysis is based on three reports that give us different views of a company's financial performance and position.
The income statement, which is also known as the profit and loss statement, tells us about a company's revenues, expenses and profits over a period.
It helps answer the question: "Did the company make money?"
The company's revenue is the amount of money it makes from selling products or services before it pays its expenses. When revenue grows, it usually means that more customers are buying from the company and the business is getting bigger.
Examples include:
Expenses are the costs that the company must pay to make money. If the company can manage its expenses well, it makes a profit
Common expenses include:
The net profit is the amount of money the company has left after it pays all its expenses.
The formula is: Net Profit = Revenue. Total Expenses
If the net profit keeps growing, it means the company is doing well financially.
The balance sheet gives us a picture of the company's situation at a certain point in time.
It follows an equation: Assets = Liabilities + Shareholders' Equity
The company's assets are things it owns that will help it make money in the future.
Examples include:
Current Assets
Non-Current Assets
The company's liabilities are debts it owes to others.
Examples include:
Current liabilities:
Long-term liabilities:
If the company has debt, it is usually more stable financially.
The shareholder's equity is the amount of money that belongs to the owners after the company pays its debts.
It includes:
If the equity is growing it means the company is strong financially in the long term.
The cash flow statement explains how money moves in and out of the company. It only looks at the cash transactions, not at how much money the company made or lost.
The operating cash flow is the money the company makes from its business activities. If the operating cash flow is positive, it means the company's core business is healthy.
Examples:
These activities involve buying or selling things that will help the company make money in the term. If the company invests in these activities, it may grow its business.
Examples:
These activities involve getting money from investors or paying back loans. These activities show us how the company gets the money it needs to run its business and grow.
Examples:
Master AI product development with Building AI Products, Systems & Services EPGC by IIT KGP, build cutting-edge systems and services. Enroll now to accelerate your tech career!
There are ways to look at financial statements. Each method of financial statement analysis helps us understand how well a company is doing financially and where it stands.
Comparison Table: on the methods of financial statement analysis:
Method |
Purpose |
Best Use Case |
| Horizontal Analysis | Measures changes in financial data over multiple periods | Tracking revenue, expenses, assets, and profit growth year over year |
| Vertical Analysis | Expresses each line item as a percentage of a base figure | Comparing companies of different sizes and analyzing cost structures |
| Ratio Analysis | Evaluates profitability, liquidity, efficiency, solvency, and valuation using financial ratios | Assessing overall financial performance, investment analysis, and credit evaluation |
| Trend Analysis | Identifies long-term financial patterns across several accounting periods | Forecasting future performance and monitoring strategic progress |
| Comparative Financial Statement Analysis | Compares financial statements with competitors, industry averages, or previous periods | Benchmarking against competitors and evaluating relative performance |
| Common-Size Analysis | Converts financial statement items into percentages of a common base for standardized comparison | Industry benchmarking, identifying spending patterns, and comparing organizations regardless of size |
When we do an analysis of financial statements, we compare numbers from different years to see if they are going up or down.
We calculate the difference between years and the percentage change.
Formula:
Percentage Change = (Current Year − Previous Year) ÷ Previous Year × 100
Example
Year |
Revenue |
| 2024 | $800,000 |
| 2025 | $920,000 |
Revenue Growth:
= (920,000 − 800,000) ÷ 800,000 × 100
= 15% growth
Best for:
This method of financial statement analysis is best for looking at growth comparing performance over time and seeing trends in revenue and expenses.
Vertical analysis of statements shows each item as a percentage of a base number.
Example (Income Statement)
Item |
Amount |
% of Revenue |
| Revenue | $1,000,000 |
100% |
| Cost of Sales | $600,000 |
60% |
| Operating Expenses | $200,000 |
20% |
| Net Profit | $200,000 |
20% |
Ratio analysis of statements looks at how different numbers relate to each other.
Major categories include:
Example: Current Ratio
Current Assets ÷ Current Liabilities
If current assets are $500,000 and current liabilities are $250,000:
Current Ratio = 2.0
This means the company has $2 in current assets for every $1 of short-term liabilities.
Trend analysis of statements looks at numbers over several years to find patterns.
For example:
Year |
Revenue |
| 2022 | $700,000 |
| 2023 | $780,000 |
| 2024 | $860,000 |
| 2025 | $940,000 |
The fact that revenue is going up every year is a sign for the company. Trend analysis of statements is often used to predict how well a company will do in the future.
This method compares a company's statements to:
For example:
Company |
Net Profit Margin |
| Company A | 18% |
| Company B | 14% |
Even though both companies are making profits, Company A is doing better.
Common-size analysis of statements makes all the numbers comparable, by showing each item as a percentage of a common base.
This method allows:
For example, if inventory is 25% of assets, but the industry average is 15%, the company might have too much inventory.
Financial statement analysis ratios are numerical metrics calculated using data from a company's financial statements. They simplify complex financial information and help analysts evaluate profitability, liquidity, operational efficiency, solvency, and market performance.
Rather than looking at absolute numbers, ratios reveal relationships between different financial figures, making it easier to compare companies, monitor performance over time, and benchmark against industry standards.
The most used financial statement analysis ratios are grouped into five categories:
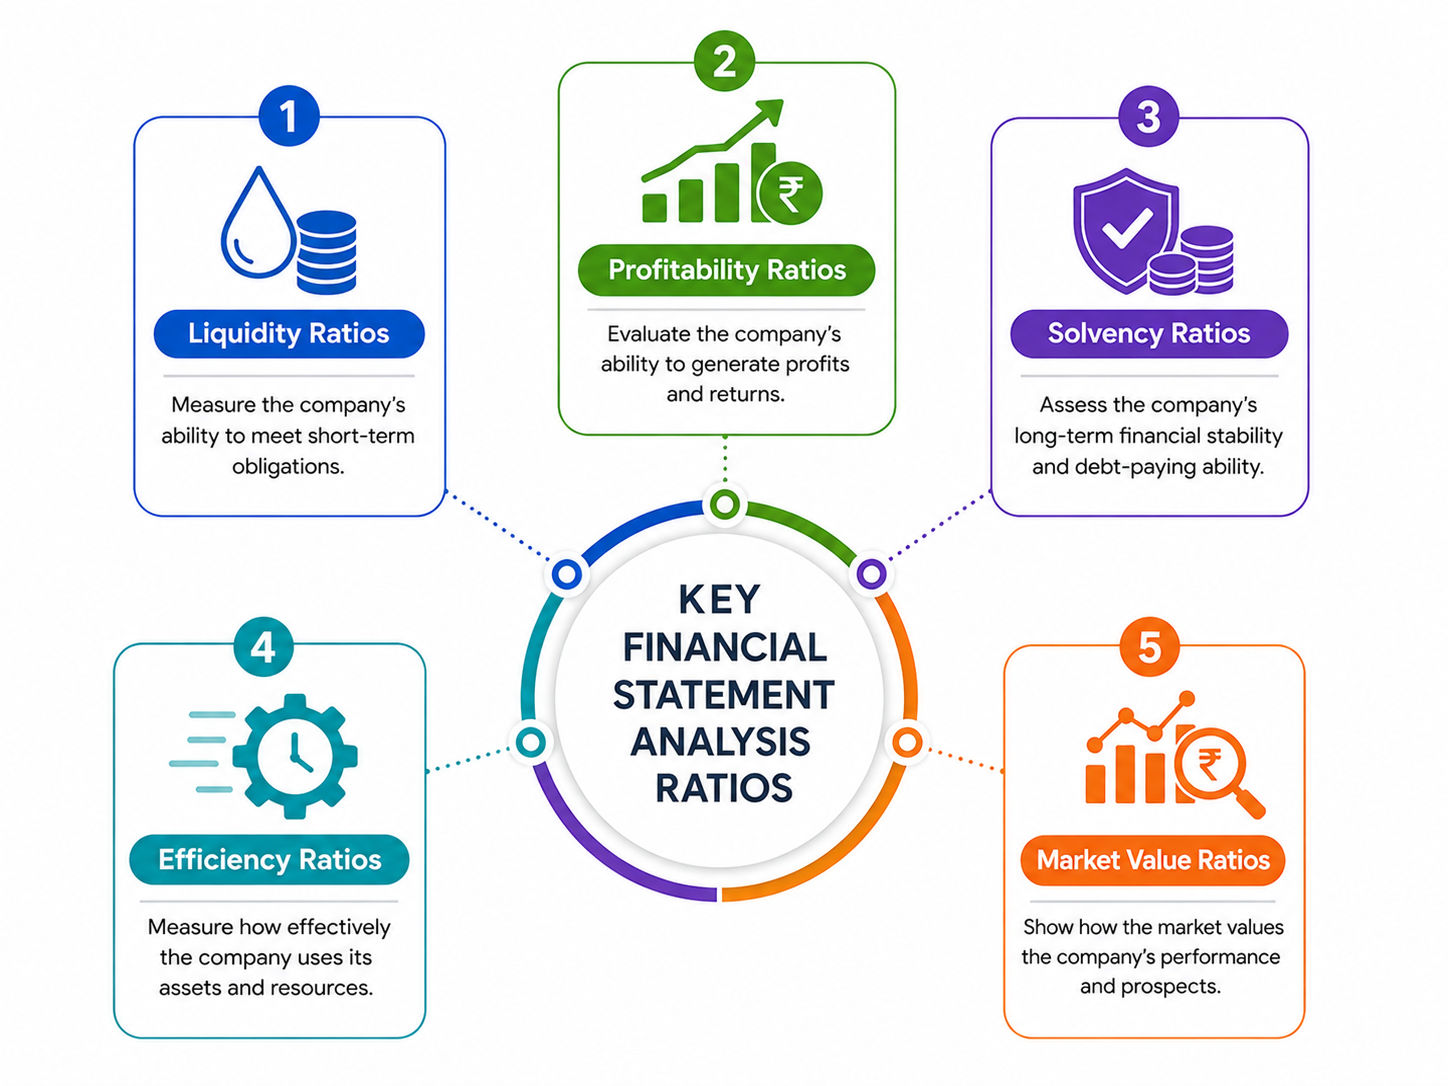
Liquidity ratios measure a company's ability to meet its short-term financial obligations using its current assets. These ratios are especially important for creditors, suppliers, and lenders.
The Current Ratio measures whether a company has enough current assets to cover its current liabilities.
Formula:
Current Ratio = Current Assets ÷ Current Liabilities
Example:
Current Ratio = 600,000 ÷ 300,000 = 2.0
This means the company has $2 in current assets for every $1 of short-term debt.
Interpretation:
The Quick Ratio, also known as the Acid-Test Ratio, measures a company's ability to pay current liabilities without relying on inventory.
Formula:
Quick Ratio = (Current Assets − Inventory) ÷ Current Liabilities
Example:
Quick Ratio = (500,000 − 150,000) ÷ 250,000 = 1.4
A ratio above 1 generally indicates sufficient liquid assets to cover short-term obligations.
The Cash Ratio is the most conservative liquidity measure because it considers only cash and cash equivalents.
Formula:
Cash Ratio = Cash and Cash Equivalents ÷ Current Liabilities
Example:
Cash Ratio = 0.6
Although lower than the current ratio, this may still be acceptable depending on the industry.
Profitability ratios evaluate how efficiently a company generates profits from its sales, assets, and shareholders' investments.
Gross Profit Margin measures how much revenue remains after deducting the cost of goods sold (COGS).
Formula:
Gross Profit Margin = (Gross Profit ÷ Revenue) × 100
Example:
Gross Margin = 40%
A higher margin indicates efficient production and pricing.
Operating Margin measures profit generated from core business operations before interest and taxes.
Formula:
Operating Margin = Operating Income ÷ Revenue × 100
Example:
Operating Margin = 20%
This ratio reflects operational efficiency and cost management.
Net Profit Margin measures the percentage of revenue that becomes net income after all expenses.
Formula:
Net Profit Margin = Net Income ÷ Revenue × 100
Example:
Net Margin = 15%
Higher margins indicate stronger profitability.
ROA measures how effectively a company uses its assets to generate profits.
Formula:
ROA = Net Income ÷ Total Assets × 100
Example:
ROA = 10%
A higher ROA indicates better asset utilization.
ROE measures return generated on shareholders' investments.
Formula:
ROE = Net Income ÷ Shareholders' Equity × 100
Example:
ROE = 25%
Investors often use ROE to compare companies within the same industry.
Solvency ratios assess a company's long-term financial stability and ability to meet debt obligations.
This ratio compares total debt with shareholders' equity.
Formula:
Debt-to-Equity Ratio = Total Liabilities ÷ Shareholders' Equity
Example:
Debt-to-Equity = 1.5
A lower ratio generally indicates lower financial risk, though acceptable levels vary by industry.
This ratio measures how comfortably a company can pay interest on its debt.
Formula:
Interest Coverage = EBIT ÷ Interest Expense
Example:
Interest Coverage = 5 times
A higher ratio indicates stronger debt repayment capability.
Efficiency ratios measure how effectively a company utilizes its assets and manages operations.
Inventory Turnover indicates how often inventory is sold during a period.
Formula:
Inventory Turnover = Cost of Goods Sold ÷ Average Inventory
Example:
Inventory Turnover = 5 times
A higher turnover usually indicates efficient inventory management.
Asset Turnover measures how efficiently assets generate sales.
Formula:
Asset Turnover = Revenue ÷ Average Total Assets
Example:
Asset Turnover = 1.33
Higher values suggest better asset utilization.
Receivables Turnover measures how efficiently customers pay outstanding invoices.
Formula:
Receivables Turnover = Net Credit Sales ÷ Average Accounts Receivable
Example:
Receivables Turnover = 8 times
A higher ratio generally indicates effective credit management and faster collections.
Market value ratios help investors assess a company's market performance and valuation.
EPS measures the profit earned for each outstanding share.
Formula:
EPS = Net Income ÷ Outstanding Shares
Example:
EPS = $3.00
A higher EPS generally reflects stronger profitability.
The P/E Ratio compares a company's share price with its earnings.
Formula:
P/E Ratio = Market Price per Share ÷ EPS
Example:
P/E = 20
A higher P/E may indicate strong growth expectations, while a lower P/E may suggest undervaluation or slower growth.
Book Value Per Share indicates the net asset value attributable to each outstanding share.
Formula:
Book Value Per Share = Shareholders' Equity ÷ Outstanding Shares
Example:
Book Value = $5 per share
Investors compare this figure with the market price to evaluate valuation.
Techniques of financial statement analysis involve a systematic review of a company's financial reports to assess performance, identify risks, and support decision-making.
Let's see the techniques of financial statement analysis:
Gather the latest and historical versions of the:
Using at least three to five years of data helps identify trends and improves the reliability of the analysis.
Compare financial statements across multiple periods to evaluate:
This historical review provides context for understanding current performance.
Compute key ratios across liquidity, profitability, efficiency, solvency, and valuation categories.
Examples include:
Ratios provide standardized measures for evaluating financial performance.
Compare the company's financial metrics with:
Benchmarking helps determine whether performance is above or below industry standards.
Use horizontal analysis, trend analysis, and graphs to identify patterns such as:
Recognizing these trends supports forecasting and strategic planning.
Summarize the findings and answer questions such as:
The final assessment should integrate quantitative data with qualitative business insights.
Modern businesses use a variety of tools and technologies to perform financial statement analysis efficiently and accurately.
Tools of financial statement analysis:
Microsoft Excel remains one of the most widely used tools of financial statement analysis due to its flexibility.
Common uses:
Excel is ideal for small businesses and analysts requiring customized financial models.
Financial modeling involves creating spreadsheet-based representations of a company's financial performance to support forecasting and decision-making.
Common models include:
Financial models help estimate future earnings, cash flows, and business value.
Enterprise Resource Planning (ERP) systems integrate financial data across departments, providing real-time visibility into organizational performance.
Popular ERP platforms include:
ERP systems streamline accounting, reporting, budgeting, and compliance while reducing manual errors.
BI tools transform financial data into interactive dashboards and visual reports.
Popular BI solutions include:
These platforms enable users to monitor KPIs, analyze trends, and create dynamic financial reports.
Artificial intelligence is increasingly used to automate and enhance financial analysis.
Capabilities include:
AI-powered platforms help finance teams save time, reduce errors, and uncover insights that may be difficult to identify manually.
Bank financial statement analysis is the process of evaluating a bank's financial performance, profitability, liquidity, asset quality, capital adequacy, and operational efficiency by analyzing its financial statements and key banking ratios.
Unlike non-financial companies, banks primarily generate income from lending, investments, and financial services, making their analysis more focused on credit risk, interest income, and regulatory compliance.
Income Statement
A bank's income statement summarizes its financial performance during a reporting period.
Key Components:
Interest Income
Balance Sheet
The balance sheet presents a bank's financial position at a specific date.
Major Assets
Major Liabilities
Shareholders' Equity
Cash Flow Statement
The cash flow statement explains cash movements related to:
Operating Activities
Investing Activities
Financing Activities
Key bank financial statement analysis ratios measure profitability, liquidity, capital strength, asset quality, and operational efficiency, helping stakeholders evaluate a bank's financial performance.
Net Interest Margin measures how efficiently a bank earns income from its interest-bearing assets.
Formula
Net Interest Margin = Net Interest Income ÷ Average Earning Assets × 100
Interpretation
CAR measures a bank's ability to absorb financial losses while meeting regulatory capital requirements.
Formula
CAR = Regulatory Capital ÷ Risk-Weighted Assets × 100
Interpretation
The NPA Ratio measures the proportion of loans that are overdue or unlikely to be repaid.
Formula
Gross NPA Ratio = Gross NPAs ÷ Gross Advances × 100
Interpretation
This ratio indicates how much of customer deposits are used for lending.
Formula
Loan-to-Deposit Ratio = Total Loans ÷ Total Deposits × 100
Interpretation
ROA measures how efficiently a bank generates profit from its total assets.
Formula
ROA = Net Profit ÷ Average Total Assets × 100
Banks typically operate with large asset bases, so even a relatively modest ROA can reflect strong performance.
ROE measures the return generated for shareholders.
Formula
ROE = Net Profit ÷ Shareholders' Equity × 100
A higher ROE generally reflects effective capital utilization.
This ratio evaluates operating efficiency.
Formula
Cost-to-Income Ratio = Operating Expenses ÷ Operating Income × 100
Lower ratios indicate better operational efficiency.
LCR measures whether a bank has sufficient high-quality liquid assets to meet short-term obligations during periods of financial stress.
A higher LCR indicates stronger liquidity and resilience.
Financial statement analysis offers significant benefits to businesses, investors, lenders, and other stakeholders.
Provides reliable financial insights that support operational, strategic, and investment decisions.
Helps evaluate profitability, operational efficiency, and financial progress over time.
Identifies liquidity issues, excessive debt, declining profitability, and other financial risks before they become critical.
Historical financial data and trend analysis improve the accuracy of budgeting and financial forecasting.
Supports long-term planning by highlighting strengths, weaknesses, growth opportunities, and resource requirements.
Transparent and consistent financial analysis builds trust among investors, lenders, and other stakeholders by demonstrating sound financial management.
Despite its benefits, financial statement analysis has several limitations that should be considered.
Financial statements primarily reflect past performance and may not accurately predict future outcomes.
Companies may use different accounting methods (such as depreciation or inventory valuation), making direct comparisons challenging.
Historical cost accounting may not reflect current market values during periods of inflation, potentially distorting financial results.
Financial statements do not capture qualitative factors such as management quality, customer satisfaction, brand reputation, employee morale, or competitive advantages.
Some companies may temporarily improve financial metrics around reporting dates through practices such as delaying expenses or accelerating revenue recognition. While these actions may comply with accounting standards, they can make financial performance appear stronger than its underlying reality.
Although the terms are often used interchangeably, they have different scopes. Financial statement analysis focuses specifically on interpreting financial reports, while financial analysis encompasses a broader evaluation of a company's financial condition using both financial and non-financial information.
Feature |
Financial Statement Analysis |
Financial Analysis |
| Definition | Evaluation of financial statements to assess performance and financial health | Broader process of evaluating all financial aspects of a business, including statements, forecasts, valuations, and market conditions |
| Primary Focus | Income statement, balance sheet, and cash flow statement | Financial performance, business strategy, investments, budgeting, valuation, and risk |
| Data Sources | Historical financial statements | Financial statements, market data, economic indicators, industry trends, forecasts, and qualitative information |
| Purpose | Measure financial performance and position | Support strategic planning, investment decisions, business valuation, and financial management |
| Scope | Narrow and statement-focused | Broad and comprehensive |
| Common Techniques | Ratio analysis, horizontal analysis, vertical analysis, trend analysis, and common-size analysis | Financial statement analysis, forecasting, budgeting, valuation models, scenario analysis, and risk assessment |
| Typical Users | Accountants, auditors, lenders, investors, and financial analysts | CFOs, financial managers, investment analysts, consultants, lenders, and corporate executives |
| Decision Support | Helps evaluate current and past performance | Helps make both short-term and long-term financial and strategic decisions |
| Output | Financial ratios, trend reports, performance comparisons | Investment recommendations, business valuations, financial forecasts, strategic plans, and risk assessments |
Financial statement analysis is most valuable when it goes beyond simply calculating ratios or reviewing annual reports. Following proven best practices helps analysts develop a more accurate understanding of a company's financial health, identify potential risks, and make informed business or investment decisions.
By combining quantitative data with industry knowledge and qualitative insights, stakeholders can draw meaningful conclusions that support strategic decision-making.
Evaluating financial statements over several accounting periods provides a clearer picture of a company's long-term performance than reviewing a single year's data.
Multi-year analysis helps identify:
For example, if a company's revenue has increased by 10% annually for the past five years while operating expenses have remained stable, it indicates sustainable growth and effective cost management. Conversely, a sudden decline in profits after years of steady growth may signal operational challenges or changing market conditions.
Best Practice: Analyze at least three to five years of financial statements to identify recurring trends and minimize the impact of one-time events.
No single financial ratio provides a complete assessment of a company's financial performance. Each ratio measures a specific aspect of the business, such as liquidity, profitability, efficiency, or solvency.
For instance:
Using a combination of ratios provides a more balanced and reliable evaluation.
A comprehensive ratio analysis should include:
Best Practice: Interpret ratios collectively rather than relying on a single metric to assess financial health.
Financial performance should always be evaluated in the context of the industry in which the company operates.
Different industries have varying norms for:
For example, a debt-to-equity ratio of 2.0 may be acceptable for capital-intensive industries such as utilities but considered high for software companies.
Benchmarking against industry averages and competitors helps determine whether a company's financial performance is above, below, or in line with market expectations.
Useful benchmarking sources include:
Best Practice: Compare financial metrics with industry peers and historical company performance to gain meaningful insights.
A profitable company is not necessarily a financially healthy company. Profitability is based on accounting principles, while cash flow reflects the actual movement of cash into and out of the business.
A company may report strong net income but still face liquidity problems if customers delay payments or significant funds are tied up in inventory.
Reviewing the cash flow statement alongside the income statement helps assess:
Positive operating cash flow is generally a strong indicator of a company's ability to support day-to-day operations and future growth.
Best Practice: Always analyze operating cash flow together with profitability metrics to evaluate the company's true financial strength.
Financial statements provide valuable quantitative information, but they do not capture every factor that influences business performance.
Qualitative considerations often play a significant role in assessing a company's long-term prospects.
Key qualitative factors include:
For example, two companies with similar financial ratios may have very different growth prospects if one has stronger leadership, superior products, or a larger market share.
Best Practice: Combine financial analysis with qualitative business assessment to develop a more comprehensive understanding of the company's performance and future potential.
Financial statement analysis is widely used by individuals and organizations that need to evaluate a company's financial condition, performance, and future prospects. Different stakeholders analyze financial statements for different purposes, depending on their objectives and decision-making needs.
Investors use financial statement analysis to determine whether a company is a worthwhile investment and to assess the potential risks and returns associated with purchasing its shares or other securities.
They evaluate factors such as:
By comparing companies within the same industry, investors can identify businesses with strong financial fundamentals and long-term growth potential.
Financial analysts perform detailed evaluations of companies to support investment recommendations, corporate planning, mergers and acquisitions, and business valuations.
Their analysis typically includes:
Analysts often prepare reports that guide institutional investors, corporate executives, and other stakeholders in making informed financial decisions.
Business owners rely on financial statement analysis to monitor performance, improve profitability, and make strategic decisions that support sustainable growth.
They use financial analysis to:
Regular analysis enables owners to identify opportunities for improvement and respond proactively to financial challenges.
Accountants prepare, review, and interpret financial statements to ensure accuracy, compliance, and transparency.
Financial statement analysis helps accountants:
Their insights help management make informed financial decisions based on reliable financial information.
Auditors analyze financial statements to determine whether they fairly represent a company's financial position and comply with applicable accounting standards.
They review:
Auditors also assess the risk of material misstatements, errors, or fraud and provide assurance to stakeholders regarding the credibility of financial reports.
Banks and other lending institutions analyze financial statements before approving loans, credit facilities, or other financing arrangements.
They assess a company's:
A strong financial profile improves the likelihood of obtaining financing on favorable terms, including lower interest rates and higher borrowing limits.
Credit rating agencies evaluate financial statements to determine the creditworthiness of companies and their ability to meet debt obligations.
Their analysis focuses on:
Based on this assessment, agencies assign credit ratings that influence borrowing costs and investor confidence.
Government agencies and regulatory authorities review financial statements to ensure compliance with financial reporting standards, tax laws, and corporate governance requirements.
Regulators use financial statement analysis to:
Regular oversight helps maintain confidence in financial reporting and supports the integrity of capital markets.
Financial statement analysis is an essential process for evaluating a company's financial performance, stability, and growth potential. By analyzing financial statements, applying ratio analysis, identifying trends, and comparing industry benchmarks, stakeholders can make well-informed decisions. When combined with qualitative insights and sound analytical practices, financial statement analysis becomes a powerful tool for strategic planning, investment evaluation, risk management, and long-term business success.
Financial statement analysis is the process of evaluating a company's financial performance and health by examining its income statement, balance sheet, and cash flow statement. It helps businesses, investors, and lenders assess profitability, liquidity, efficiency, risks, and overall financial stability for informed decision-making.
The three primary financial statements are the income statement, balance sheet, and cash flow statement. Together, they provide insights into a company's profitability, financial position, and cash movements, offering a comprehensive view of its financial performance and long-term financial health.
The five common methods are horizontal analysis, vertical analysis, ratio analysis, trend analysis, and comparative financial statement analysis. These techniques help evaluate financial performance, identify trends, compare companies or periods, and support strategic planning, investment decisions, and financial risk assessment.
Ratio analysis is important because it converts financial data into meaningful metrics that measure profitability, liquidity, efficiency, solvency, and valuation. It enables stakeholders to compare companies, monitor financial performance over time, identify weaknesses, and make well-informed business and investment decisions.
Horizontal analysis compares financial statement items across multiple accounting periods to measure growth or decline. It calculates absolute and percentage changes in financial data, helping businesses identify performance trends, evaluate progress, and detect potential financial issues over time for better planning.
Vertical analysis expresses each financial statement item as a percentage of a base figure, such as total revenue or total assets. This method simplifies comparisons between companies of different sizes and helps analyze cost structures, profitability, and overall financial composition more effectively.
Financial statement analysis helps investors evaluate a company's profitability, liquidity, debt levels, cash flow, and growth potential. By analyzing financial performance and key ratios, investors can identify attractive investment opportunities, assess risks, compare companies, and make more confident investment decisions.
Financial statement analysis relies on historical data and may be affected by accounting for policy differences, inflation, and potential financial statement manipulation. It also overlooks qualitative factors such as management quality, brand reputation, market conditions, and future business opportunities that influence performance.
The most important financial ratios include the Current Ratio, Quick Ratio, Net Profit Margin, Return on Assets (ROA), Return on Equity (ROE), Debt-to-Equity Ratio, Inventory Turnover, Earnings Per Share (EPS), and Price-to-Earnings (P/E) Ratio for comprehensive financial evaluation.
Financial statement analysis evaluates a company's historical financial performance using financial reports and ratios. Financial modeling goes further by building forecasts and financial projections to estimate future performance, business valuation, investment outcomes, and the impact of different financial scenarios.
The objectives of financial statement analysis are to evaluate a company's profitability, liquidity, solvency, efficiency, and overall financial health. It also supports investment and lending decisions, identifies financial risks, measures business performance, improves strategic planning, and enables comparisons with competitors and industry benchmarks.
The main tools of financial statement analysis include comparative statements, common-size statements, trend analysis, ratio analysis, cash flow analysis, and horizontal and vertical analysis. These tools help evaluate profitability, liquidity, efficiency, solvency, financial trends, and overall business performance for better decision-making.
Financial statement analysis is the process of examining and interpreting a company's financial reports to evaluate its profitability, liquidity, solvency, efficiency, and overall financial performance. It helps investors, managers, lenders, and stakeholders make informed financial decisions.
972 articles published
We are an online education platform providing industry-relevant programs for professionals, designed and delivered in collaboration with world-class faculty and businesses. Merging the latest technolo...
Get Free Consultation
By submitting, I accept the T&C and
Privacy Policy
Top Resources
Certification
3 Months
Certification
6 Months
O.P. Jindal Global University
Masters in International Accounting and Finance (Accredited by ACCA, UK)Master's Degree
12 Months