Univariate Analysis: Types, Examples and Uses
By Sriram
Updated on Aug 25, 2026 | 74 views
Share:

All courses
Certifications
More
By Sriram
Updated on Aug 25, 2026 | 74 views
Share:
Table of Contents
Key Highlights
Ready to master database concepts and advance your tech skills? Explore upGrad’s data science online training and gain practical, industry-relevant skills for a data-driven career.
Popular Data Science Programs
Univariate analysis examines one variable at a time. It helps you understand the variable’s values, distribution, frequency, and basic patterns without comparing it with another variable.
For example, a teacher records the mathematics marks of 50 students. Studying their average score, highest and lowest marks, or score distribution is univariate analysis.The aim isn't to explain why scores differ. It’s simply to understand what the data shows.
What you measure depends on the type of variable. Numerical and categorical data need different ways of summarising the results.
For numerical data, researchers may look at:
For categorical data, they may use:
It doesn't always require complex calculations. A simple frequency table can answer the question clearly.
For example, a survey asks 500 people about their preferred payment method. Counting responses for cash, debit card, credit card, and digital payment studies just one variable, making it univariate analysis. The same approach can be used in education, healthcare, business, marketing, and social science research.
A dataset can contain hundreds or thousands of observations. Looking at raw values alone can make patterns difficult to spot.
It helps researchers identify the typical value, variation, frequency, and distribution of observations. It can also reveal missing or unusual values that might affect later analysis.
For instance, a researcher analysing household income might discover a few extremely high values. Those observations could affect the mean, so checking the distribution before further analysis becomes useful.
The method isn’t designed to explain relationships between variables. Its strength is descriptive clarity.
Read: What Is Data Science? Courses, Basics, Frameworks & Careers
Free Courses
The type of univariate analysis depends on the data and what you want to find from it. Researchers usually use statistical summaries, frequency counts, and charts to study one variable.
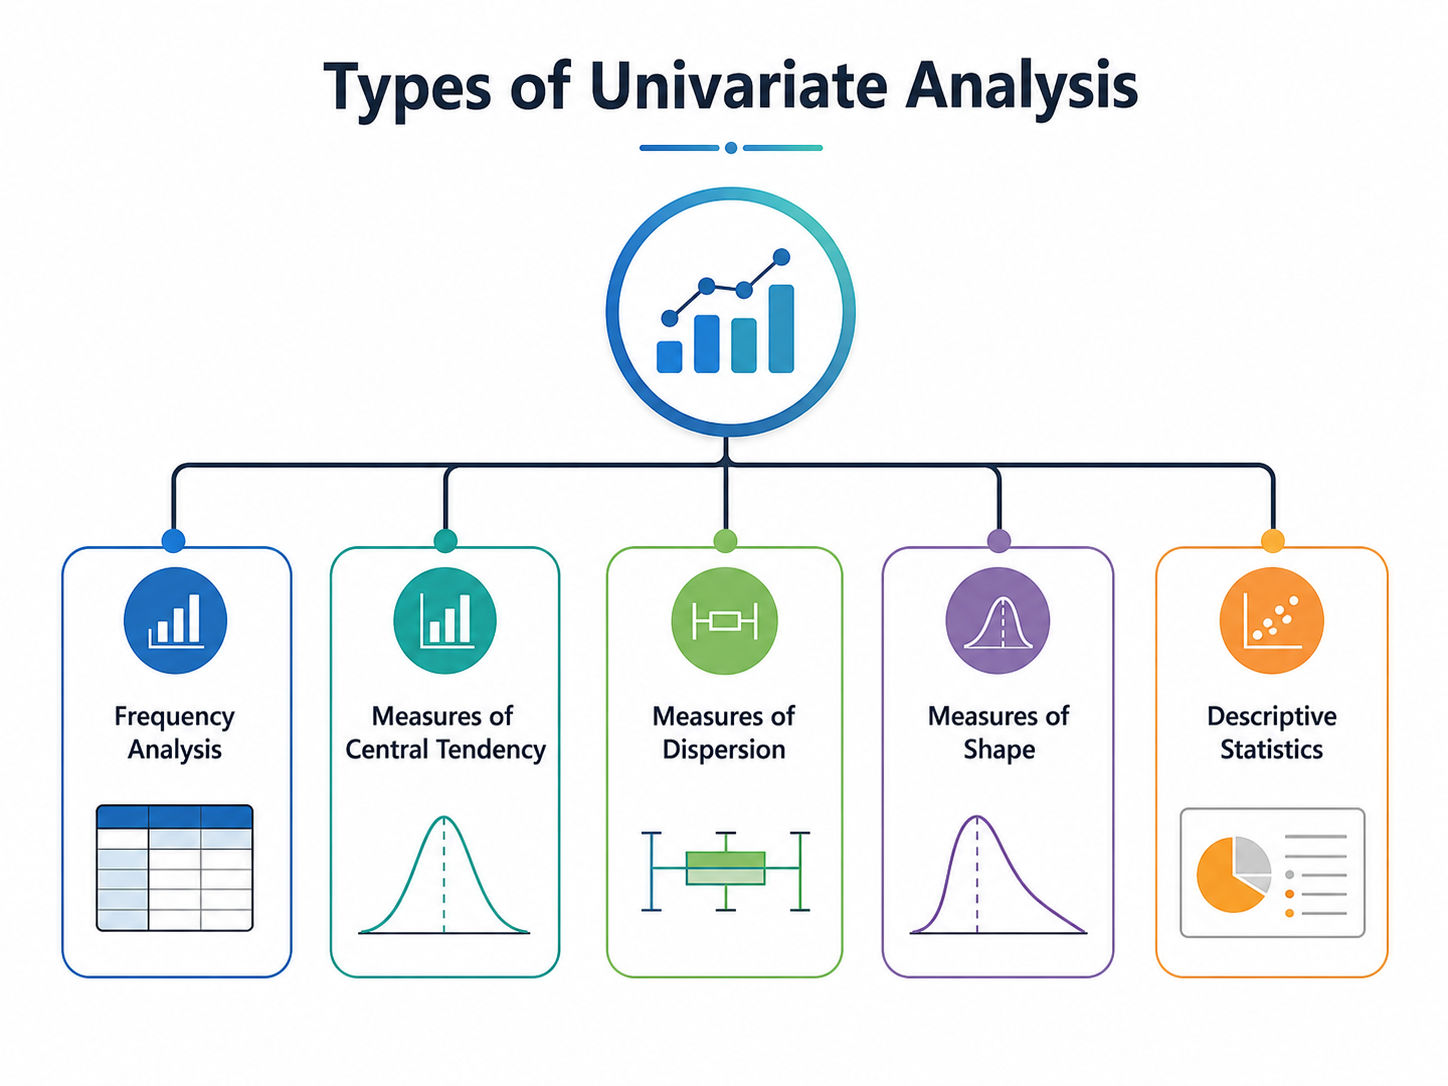
Descriptive statistics turn a set of numbers into a few useful figures. Common measures include mean, median, mode, range, variance, and standard deviation.
For example, if five students score 60, 65, 70, 75, and 80, the mean shows the average score, while the range shows the gap between the lowest and highest scores.
The median is useful when extreme values affect the average. If one employee earns far more than everyone else, the mean salary could be misleading, while the median may better reflect the typical salary.
Frequency analysis shows how often each value or category appears. It’s especially useful for survey responses and other categorical data.
For example, a retailer could record customers’ preferred product categories
Product category |
Customers |
Percentage |
| Electronics | 320 |
32% |
| Clothing | 280 |
28% |
| Groceries | 250 |
25% |
| Home products | 150 |
15% |
Only one variable is being studied, so this is still univariate analysis.
Charts can make a distribution much easier to understand. The choice depends on the type of data.
Common options include:
A pie chart can work for a few categories, but it becomes harder to read as the number of categories increases.
Central tendency shows the typical value in a dataset. The three common measures are mean, median, and mode.
The mean gives the average, the median gives the middle value, and the mode shows the most frequent value.
Which one should you choose? It depends on the data. The median is often more useful when extreme values could pull the mean away from the typical observation.
Ready to take your technology leadership skills to the next level? Explore upGrad’s Chief Technology Officer Program – CTO & AI Course & Certification and build the strategic, AI-driven expertise needed to lead technology teams and drive digital transformation.
Data Science Courses to upskill
Explore Data Science Courses for Career Progression
IIIT Bangalore
Executive Post Graduate Certificate in Data Science & AIPlacement Assistance
Univariate analysis helps researchers study one variable before looking at relationships between variables. It can be used for age, income, satisfaction, study time, attendance, or other research data.
For example, a university studying students’ daily study time could examine the mean, median, minimum, maximum, standard deviation, and overall distribution. If most students study two to four hours a day, that finding can be reported without comparing it with exam scores.
Researchers use it to:
It’s a useful starting point because researchers can spot data issues before moving to more complex methods.
Also Read: DBMS vs. RDBMS: Understanding the Key Differences, Features, and Career Opportunities
Say a store owner records the number of products 100 customers purchase in one visit. The researcher can compute mean, median, most common value and frequency of purchases.
It is univariate analysis as only the number of products purchased is studied.
Another instance is student attendance. A school can calculate the average attendance and create a histogram to visualise the distribution of attendance.
A survey asks 500 customers about their preferred delivery option.
Delivery option |
Customers |
| Standard | 240 |
| Express | 140 |
| Same-day | 80 |
| Store pickup | 40 |
The researcher is studying only delivery preference. Counting responses and calculating percentages makes this a univariate analysis example.
Also Read: Top 10 Data Modeling Tools You Must Know
Suppose a retailer studies monthly customer spending. The researcher can calculate the mean and median and use a histogram to see how spending is distributed.
The key question is simple. How many variables are being analysed?If there’s only one, you’re dealing with univariate analysis.
The main difference is the number of variables studied. Univariate analysis looks at one variable, while bivariate analysis examines two variables to find a relationship or comparison.
For example, studying customer age alone is univariate. Studying customer age and purchase value together is bivariate.
Feature |
Univariate Analysis |
Bivariate Analysis |
| Variables | One | Two |
| Purpose | Describe a variable | Examine relationships |
| Common methods | Mean, median, frequency | Correlation, cross-tabulation |
| Example | Customer age | Age and purchase value |
| Output | Summary or distribution | Relationship or comparison |
The difference becomes clearer with three levels of analysis. One variable means univariate, two means bivariate, and three or more moves into multivariate analysis.
Choose the method based on your question.
Also Read: Top 10 Data Modeling Tools You Must Know
The key difference is the number of variables involved. Univariate analysis studies one variable, while multivariate analysis looks at several variables together to understand patterns or relationships.
Take a real estate dataset. Studying house prices alone is univariate. Studying price along with location, floor area, bedrooms, and property age is multivariate.
Feature |
Univariate Analysis |
Multivariate Analysis |
| Variables | One | Multiple |
| Focus | Individual variable | Several variables together |
| Example | House price | Price, size, location, age |
| Common methods | Mean, median, frequency | Regression, factor analysis, clustering |
| Purpose | Describe data | Study patterns and relationships |
These methods aren't alternatives. They answer different questions. Researchers can first understand individual variables and then move to a broader analysis.
Imagine a company studying employee salaries. It can first analyse salary using the mean and median. Later, it can examine salary with experience, education, job role, and location.
The first stage is univariate analysis. The second is multivariate analysis. Starting with individual variables makes the larger dataset easier to understand.
Also Read: Common Career Mistakes in Data Science and How to Avoid Them
The difference comes down to how many variables you study.
Analysis type |
Variables |
Main question |
Example |
| Univariate | 1 |
What does this variable look like? | What is the average salary? |
| Bivariate | 2 |
Are two variables related? | Is experience related to salary? |
| Multivariate | 3 or more |
How do several variables work together? | How do experience, education, and role relate to salary? |
Think of employee data. You might first study salary, then salary and experience, and finally salary with experience, education, role, and location.
Start with your research question.
You don't need the most complex method. Pick the one that fits the question you’re trying to answer.
Also Read: Getting Started with Data Exploration: A Beginner's Guide
Univariate analysis makes individual variables easier to understand. It gives researchers a clear picture of the data before they move to more complex analysis.
It’s simple to perform and interpret, which makes it useful for beginners as well as researchers working with large datasets.
Key advantages include:
Univariate analysis focuses on one variable, so it can't explain relationships, differences, or causes involving other variables.
For example, low customer satisfaction scores don't reveal whether pricing, delivery delays, or service quality caused the issue.
Summary measures can also hide patterns. An average may be misleading when extreme values affect the result, so researchers should examine the data distribution carefully.
Also Read: The Data Science Process: Key Steps to Build Data-Driven Solutions
Univariate analysis follows a simple process. Start with one variable, understand its data type, check its quality, and then select suitable measures and visuals.
Step 1: Identify the Variable
Choose the single variable you want to analyse. It could be age, income, test scores, customer ratings, or product category.
Step 2: Identify the Data Type
Determine whether the variable is categorical, ordinal, discrete, or continuous. This helps you select the right statistical measures and charts.
Step 3: Check the Data
Look for missing values, duplicate entries, incorrect values, and unusual observations. Even one incorrect value can affect the results, especially in a small dataset.
Step 4: Select Suitable Measures
Choose statistics based on the data type.
Step 5: Choose a Suitable Chart
Visuals make patterns easier to spot.
Step 6: Interpret the Results
Don't stop after calculating the numbers. Look at what they actually tell you.
For example, an average customer rating of 3.8 might seem positive. However, the distribution could show that ratings are split between very satisfied and very dissatisfied customers.
Univariate analysis helps researchers understand one variable before moving to more complex statistical methods. It can reveal common values, data spread, frequencies, and unusual observations, making the dataset easier to read and interpret.
Start with the variable that answers your research question. If you later need to examine relationships between variables, you can move to bivariate or multivariate analysis. This approach keeps the analysis focused and helps you choose a suitable method instead of using a technique simply because it’s more advanced.
Ready to start your journey? Book a free consultation with upGrad today to find the best path for your career
The main purpose is to describe and understand one variable independently. It can show the variable’s frequency, central value, spread, or distribution. Researchers use it to inspect their data before moving to analyses that involve relationships between two or more variables.
Univariate analysis can be used with both qualitative and quantitative data. Categorical data can be summarised using frequencies and percentages, while numerical data can be examined using measures such as mean, median, range, and standard deviation.
Common tools include frequency tables, percentages, mean, median, mode, range, variance, and standard deviation. Researchers may also use bar charts, histograms, pie charts, or box plots to display the distribution of a single variable.
Yes. A frequency table can represent univariate analysis when it describes one variable. For example, counting how many survey participants selected each education level examines only education level, without analysing its relationship with another variable.
Yes. Certain techniques can help identify unusual observations in a single variable. A box plot, range, or standard deviation can reveal values that differ substantially from the rest of the dataset, although the researcher should investigate whether those values are genuine or data-entry errors.
Univariate analysis focuses on one variable, while descriptive statistics refers to methods used to summarise data. Descriptive statistics can be applied within univariate analysis, but they can also be used when summarising multiple variables separately.
Yes. Survey researchers frequently use it to summarise individual questions. For example, responses to a question about satisfaction can be shown through frequencies, percentages, or a chart without examining the relationship between satisfaction and another survey variable.
Univariate analysis describes one variable independently, while regression examines relationships between variables and can be used for prediction. For example, analysing salary alone is univariate, whereas predicting salary using experience and education involves a regression model.
It depends on the research question. If the goal is to describe individual variables, it may be enough. If the researcher wants to examine relationships, causes, associations, or predictions, additional methods involving multiple variables will usually be required.
Think about one column in a dataset. If you examine only that column and describe its values, frequency, average, or distribution, you're performing univariate analysis. Once you bring another column into the analysis, you're moving toward bivariate or multivariate methods.
It gives researchers an initial understanding of the data. They can identify missing values, unusual observations, incorrect entries, and unexpected distributions before applying more advanced methods, which can reduce the risk of interpreting results from poorly understood or problematic data.
730 articles published
Sriram K is a Senior SEO Executive with a B.Tech in Information Technology from Dr. M.G.R. Educational and Research Institute, Chennai. With over a decade of experience in digital marketing, he specia...
Speak with Data Science Expert
By submitting, I accept the T&C and
Privacy Policy
Start Your Career in Data Science Today
Top Resources
Master's Degree
18 Months
Executive Diploma
12 Months
Bootcamp
6 Months