RFM Analysis: What It Is, How to Calculate It, and How to Use It
By Sriram
Updated on Jul 28, 2026 | 16 min read | 4.41K+ views
Share:

All courses
Certifications
More
By Sriram
Updated on Jul 28, 2026 | 16 min read | 4.41K+ views
Share:
Table of Contents
Quick Overview
This blog covers everything you need to understand and apply RFM analysis in your own business. You will learn what RFM analysis means, how to calculate an RFM score, how to segment customers based on their scores, and how it compares to other customer analysis methods.
If you want to go beyond the basics and start applying methods like RFM analysis to real customer data using SQL, Python, and visualization tools, upGrad's Data Science courses can help you build these skills hands-on, from customer segmentation to predictive analytics, and open doors across industries that run on data.
Popular Data Science Programs
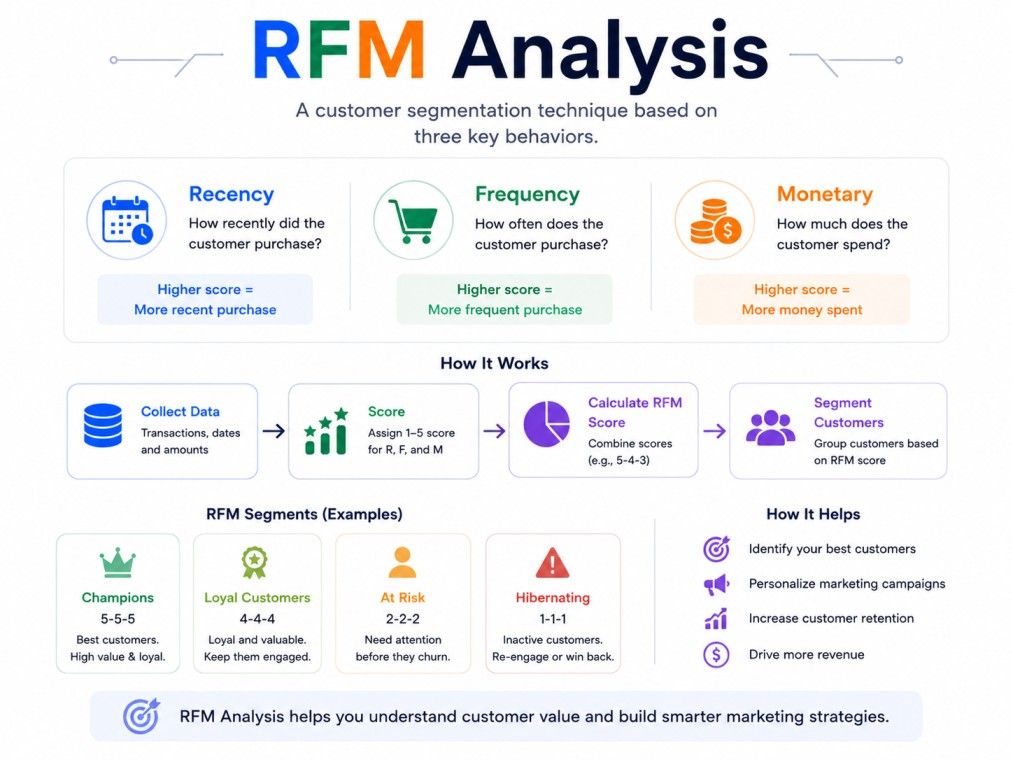
RFM analysis is a method used to study customer behaviour based on three metrics: Recency, Frequency, and Monetary value.
It helps businesses understand which customers are the most valuable and which ones need attention. Instead of treating every customer the same, RFM analysis groups them based on real buying patterns.
The idea has been around since the 1990s in direct mail marketing, but it works just as well today for ecommerce, retail, and subscription businesses. It is popular because it is easy to understand and does not require complicated statistics to get started.
Here is what each term means in simple words:
Businesses use RFM analysis because it turns raw transaction data into clear, actionable customer groups. Instead of sending the same email to every customer, you can talk to your best buyers differently from someone who has not shopped in months.
In marketing, RFM analysis is mainly used to personalise campaigns. Marketing teams use it to decide who gets a discount, who gets a loyalty reward, and who gets a win-back email. It removes the guesswork from customer targeting.
If you're looking to build the strategic and decision-making skills to apply insights like RFM analysis at a leadership level, IIM Bangalore's General Management for Young Leaders (YLP) in collaboration with upGrad can help you build a strong foundation in business strategy, marketing, and data-driven decision making, and prepare you for leadership roles across industries.
Free Courses
Once you understand what is RFM analysis, the next step is learning how to do RFM analysis in practice. This starts with calculating a score for each customer based on the three metrics.
There is no single fixed formula, but most businesses follow this basic method:
A common way to assign scores is by splitting customers into five equal groups, called quintiles, for each metric.
Metric |
Score 5 (Best) |
Score 1 (Lowest) |
| Recency | Bought very recently | Bought a long time ago |
| Frequency | Buys very often | Buys rarely |
| Monetary | Spends the most | Spends the least |
Once each customer has a score for R, F, and M, you combine them into a single code, like 4-5-3. This code becomes the basis for grouping customers into segments, which we cover in the next section.
Data Science Courses to upskill
Explore Data Science Courses for Career Progression
IIIT Bangalore
Executive Post Graduate Certificate in Data Science & AIPlacement Assistance
Seeing RFM analysis in action makes it easier to understand than just reading definitions.
Customer A bought 3 days ago. Customer B bought 200 days ago. If your recency scale is 1 to 5, Customer A might score a 5, while Customer B might score a 2.
Customer A has placed 15 orders this year. Customer B has placed 2 orders. Customer A would score much higher on frequency, maybe a 5, compared to Customer B's score of 2.
Customer A has spent ₹60,000 this year. Customer B has spent ₹4,000. On the monetary scale, Customer A clearly scores higher, likely a 5, while Customer B scores around a 1 or 2.
Putting it together, Customer A might get an RFM score of 5-5-5, making them a top-tier customer. Customer B might get a score of 2-2-1, placing them in a lower-value or at-risk group. This single combined score tells you instantly who deserves priority attention.
Once you have RFM scores for every customer, the next step is grouping them into meaningful segments. This is where RFM analysis becomes genuinely useful for decision making.
Here are the segments most businesses use:
Segment |
Typical Score Pattern |
Description |
| Champions | High R, High F, High M | Your best and most loyal customers |
| Loyal Customers | High F, Medium-High M | Buy often, may not always buy recently |
| Potential Loyalists | High R, Medium F | Recent buyers who could become loyal |
| At Risk | Low R, High F/M | Used to buy often but have gone quiet |
| Hibernating | Low R, Low F, Low M | Inactive customers unlikely to return |
| Lost | Very low across all three | Rarely worth targeting again |
A high score across all three metrics means a highly valuable, engaged customer. A low recency score paired with high frequency and monetary scores usually signals a customer who used to be loyal but has stopped buying, which is worth investigating. Reading the pattern, not just the number, is what makes RFM analysis useful.
If you are wondering how to do RFM analysis from scratch, here is a practical process you can follow.
Step 1: Gather Transaction Data
Collect purchase history including customer ID, purchase date, and order value. This data usually comes from your CRM, ecommerce platform, or point of sale system.
Step 2: Calculate R, F, and M Values
For each customer, calculate days since last purchase, total number of purchases, and total amount spent within your chosen time frame.
Step 3: Score and Segment Customers
Rank each metric on a scale, typically 1 to 5, and combine the scores. Group customers into segments based on their combined score, as shown earlier.
Step 4: Turn Segments into Action
This is the step many businesses skip. Once segments are ready, build specific actions for each one, such as reward emails for Champions or win-back offers for At Risk customers. Without this step, RFM analysis stays a spreadsheet exercise instead of a business tool.
Subscribe to upGrad's Newsletter
Join thousands of learners who receive useful tips
RFM analysis is not the only way to study customer behaviour. Here is how it compares to a few common alternatives.
CLV predicts how much revenue a customer will generate over their entire relationship with your business. RFM analysis, on the other hand, looks at past behaviour to segment customers right now.
CLV is forward-looking and predictive. RFM is backward-looking and descriptive. Many businesses use both together, since RFM segments can feed into CLV models.
Cohort analysis groups customers based on when they joined or made their first purchase, then tracks how each group behaves over time. RFM analysis does not care when a customer joined.
It only cares about their recent buying behaviour. Cohort analysis is better for studying trends over time, while RFM analysis is better for immediate segmentation.
Behavioural segmentation is a broader category that includes browsing habits, product preferences, and engagement with content, not just purchases.
RFM analysis is actually a specific type of behavioural segmentation, focused only on transaction data. If you want a fuller picture of customer behaviour, RFM is often combined with other behavioural signals like website activity or app usage.
Like any method, RFM analysis has clear strengths and real limitations. Knowing both helps you use it correctly.
The benefits of RFM analysis include:
RFM analysis also has some real limitations:
If most of your customers cluster at one end of the scale, your quintile splits may need adjusting.
Try using custom score ranges instead of equal quintiles, especially if your customer base is small or uneven.
New customers usually score low on frequency and monetary value simply because they have not had time to build history.
Consider scoring them separately or excluding them from RFM analysis until they cross a minimum order count.
Combine RFM analysis with additional data like product category, discount usage, or customer feedback.
Also, review and update your RFM model regularly, since customer behaviour shifts over time.
RFM analysis is used across industries wherever repeat purchases matter.
By identifying At Risk and Hibernating segments early, businesses can step in with targeted offers before a customer fully churns. This is one of the most practical benefits of RFM analysis for retention teams.
Ecommerce brands use RFM analysis to decide who gets abandoned cart reminders, who gets early access to sales, and who gets excluded from generic promotions to avoid discount fatigue.
Different segments need different actions:
Running RFM analysis once is not enough. You need to track whether it is actually improving business results.
1. Retention Rate
Track whether customers in the Champions and Loyal segments continue to stay active over time. A stable or improving retention rate is a good sign your segmentation is working.
2. Repeat Purchase Rate
Measure how many customers are placing a second or third order after your RFM-based campaigns. An increase suggests your frequency-focused actions are effective.
3. Reactivation Rate
For At Risk and Hibernating segments, track how many customers return to buy again after a win-back campaign. This tells you if your recovery strategy is working.
4. Revenue per Customer
Compare average revenue per customer across segments before and after applying RFM-driven actions. Growth here shows your monetary-focused strategies are paying off
5. Segment Movement Over Time
Watch how customers move between segments month to month. Customers moving from At Risk back to Loyal is a strong positive signal. Customers slipping from Champions to At Risk needs immediate attention.
Start small. Pick a 12-month data window, calculate RFM scores using a spreadsheet or basic SQL query, and group customers into five or six segments.
Test one campaign per segment, such as a reward email for Champions and a discount for At Risk customers. Track results for a month, then refine your scoring rules based on what you learn.
You do not need expensive software to begin. A simple spreadsheet with recency, frequency, and monetary columns is enough to start doing RFM analysis properly.
RFM analysis is one of the simplest and most practical ways to understand your customers. It does not need complex tools or advanced data science skills to get started. All it takes is transaction data you likely already have, a bit of scoring logic, and a willingness to act on what the segments tell you.
Want to get started with Data Science? Speak with an expert for a free 1:1 counselling session today.
RFM stands for Recency, Frequency, and Monetary value. These three metrics together describe how recently a customer bought, how often they buy, and how much they spend, forming the basis of RFM analysis.
There is no fixed number, but most businesses use between six and ten segments, such as Champions, Loyal Customers, At Risk, and Lost. The exact number depends on your business size and how detailed you want the segmentation to be.
An ideal RFM score is typically 5-5-5 on a five-point scale, meaning the customer bought recently, buys often, and spends a lot. However, what counts as ideal depends on your specific scoring range and business goals.
Yes, RFM analysis works well alongside methods like cohort analysis or behavioural segmentation. Combining them gives a fuller picture, since RFM covers past transactions while other methods add context like engagement or timing.
In retail, RFM analysis helps identify which customers to prioritise for loyalty programs, seasonal promotions, and personalised offers. It also flags customers who have stopped visiting stores or making purchases, so retailers can win them back.
Email marketers use RFM segments to send different messages to different groups. Champions might get exclusive previews, while At Risk customers get a re-engagement email with a special offer instead of a generic newsletter.
Yes, though frequency needs to be interpreted differently since subscriptions often involve regular billing cycles rather than individual purchases. Subscription businesses often adapt the frequency metric to track renewal consistency instead.
Yes, B2B companies can use RFM analysis, though purchase cycles are usually longer and order values higher. The core logic stays the same, but the time windows and score thresholds often need to be adjusted for B2B buying patterns.
Yes, a basic spreadsheet template with columns for customer ID, last purchase date, order count, and total spend is enough to begin. Many free templates are available online, or you can build one manually using the steps covered in this blog.
With a small dataset, quintile-based scoring may not work well since there are not enough customers to split evenly. In this case, use custom score thresholds based on your business context instead of automatic percentile splits.
Missing data, such as incomplete purchase records, should be cleaned or excluded before scoring, since it can distort recency and frequency calculations. If a customer has partial data, consider scoring them separately or flagging them until more data is available.
720 articles published
Sriram K is a Senior SEO Executive with a B.Tech in Information Technology from Dr. M.G.R. Educational and Research Institute, Chennai. With over a decade of experience in digital marketing, he specia...
Speak with Data Science Expert
By submitting, I accept the T&C and
Privacy Policy
Start Your Career in Data Science Today
Top Resources
Master's Degree
18 Months
Executive Diploma
12 Months
Bootcamp
6 Months