Quality Management Tools: Types, Techniques, and Examples
By Sriram
Updated on Sep 06, 2026 | 11 min read | 4.24K+ views
Share:

All courses
Certifications
More
By Sriram
Updated on Sep 06, 2026 | 11 min read | 4.24K+ views
Share:
Table of Contents
Key Highlights
Explore upGrad’s Management Certification Courses to build practical knowledge and learn how to apply effective management tools and techniques in real-world business situations.
Popular Management Programs
The 7 basic tools of quality management are simple methods for compiling, organizing, analyzing and presenting quality related information. These are commonly used because they do not require advanced knowledge of statistics and can be applied to many different process improvement problems.
The seven tools are:
Each tool looks at quality from a different angle. For example, a check sheet helps collect information, while a Pareto chart helps identify which problems deserve attention first.
A cause and effect diagram otherwise called a fishbone, or Ishikawa diagram assists teams in brainstorming on the reasons for a certain issue. The tool helps in reviewing the problem’s root causes and later on analyzing the most probable cause that triggered the difficulty in the first place.
The identified causes are grouped into main categories including people, methods, machinery, materials, and environment. In this case, a company manufacturing numerous products using machines and other physical tools such as computers may decide to use the diagram to review the causes of defective products.
Using this tool makes it possible to determine various reasons for a problem occurrence especially when multiple difficulties co-exist alongside a single main issue. The tool is appropriate when there is a need to develop a list of all possible causes for a given difficulty or problem.
A check sheet is a simple form that can be used to collect and organize information while an activity is happening.
Rather than having to remember information, people can write it on the sheet. Using the sheet allows people to gather the necessary information that can be further analyzed.
For example, manufacturing facilities can use a check sheet to track the number of defects produced by their products per day. This would allow an understanding of the most prominent issues within the process after a few days.
The check sheet, therefore, can help turn observations into information that can be analyzed.
A control chart is a tool that is used to analyse trends within a process. It aids in distinguishing between normal and abnormal process variations.
A process that is under control rarely generates products that are all the same. However, there are several inherent fluctuations that are likely to be present. Nonetheless, an erratic change or irregularity may indicate abnormal or out-of-control process.
For example, a manufacturing company might use a control chart to monitor and evaluate the weight of a bottle at different stages. By setting up control limits, it will be possible for the company to determine when the process is out of control, thus necessitating corrective measures.
From the above discussion, it is evident that control charts should be employed to standardize processes and identify quality issues within the process.
A histogram displays numerical data using connected bars to show how values are distributed. It can help a team understand whether results are concentrated around a particular range, widely spread, or affected by unusual values. For example, a bakery may record the weight of hundreds of products. A histogram can show how frequently different weight ranges occur. If most products are close to the target weight, the process may be relatively consistent. A wide spread may indicate a need for further investigation. Histograms are especially useful when teams need to understand the distribution and variation within a set of measurements.
A Pareto chart is used to display information in the form of bars and line graphs to indicate the vital few causes from the many factors that contribute to the issue. This chart is also known as the 80/20 rule, which means that 80% of the problems arise from 20% of the reasons.
For instance, there are various complaints from customers about the operations in the call centres, such as slow response, provision of wrong information, technical difficulties, billing issues, and poor communication. In this case, the Pareto chart will demonstrate the most common complaints in order to prioritise the areas that need improvement.
Also Read: Project Quality Management: Cost of Quality Concept Explained
A scatter diagram, which is sometimes referred to as a scatter plot, is a type of graph that is used to determine if there is a relationship between two variables. On the graph, the observations are plotted as points. A scatter diagram can be used to visualize whether two variables are related.
It is critical to understand the difference between correlation and causation with scatter diagrams. For instance, the production team in an organization can decide to plot the temperature of a machine against the number of defective items produced. If it is observed that the number of defective products increases when the machine’s temperature increases, it does not necessarily mean that the rise in temperature is causing the defect.
A flowchart defines the process by which an activity takes place using symbols and connecting lines.
Thus, a flowchart helps to identify the process that can reduce or eliminate extra steps, simplify work flows, shorten the time taken during a process, locate possible causes of malfunction, and determine where problems occur.
For instance, a company can design a flowchart of handling a customer’s complaint, ranging from registering the complaint to investigating and solving it.
A flowchart is essential when determining a current process that needs to be improved.
Quality Tool |
Main Purpose |
Example |
| Cause-and-Effect Diagram | Identify possible causes | Finding reasons for defects |
| Check Sheet | Collect data | Recording errors |
| Control Chart | Monitor variation | Tracking production quality |
| Histogram | Analyse distribution | Examining defect frequency |
| Pareto Chart | Prioritise problems | Identifying major defect types |
| Scatter Diagram | Study relationships | Comparing temperature and defects |
| Flowchart | Map processes | Visualising workflow |
Businesses use quality management tools because quality problems are rarely solved effectively through guesswork alone. These tools provide a structured way to examine what is happening and decide what needs to change.
They can help organisations:
The value comes from using the right tool for the right situation. A control chart, for instance, is useful for monitoring variation, while a fishbone diagram is better suited to investigating possible causes.
Build practical business and leadership skills with the Master of Business Administration from Paris School of Business with IIM Lucknow Certification. Explore the program to strengthen your understanding of management and prepare for real-world business challenges.
Free Courses
The seven basic tools are only part of the wider collection of methods used for quality improvement. Depending on the industry and problem, teams may use several quality management tools together.
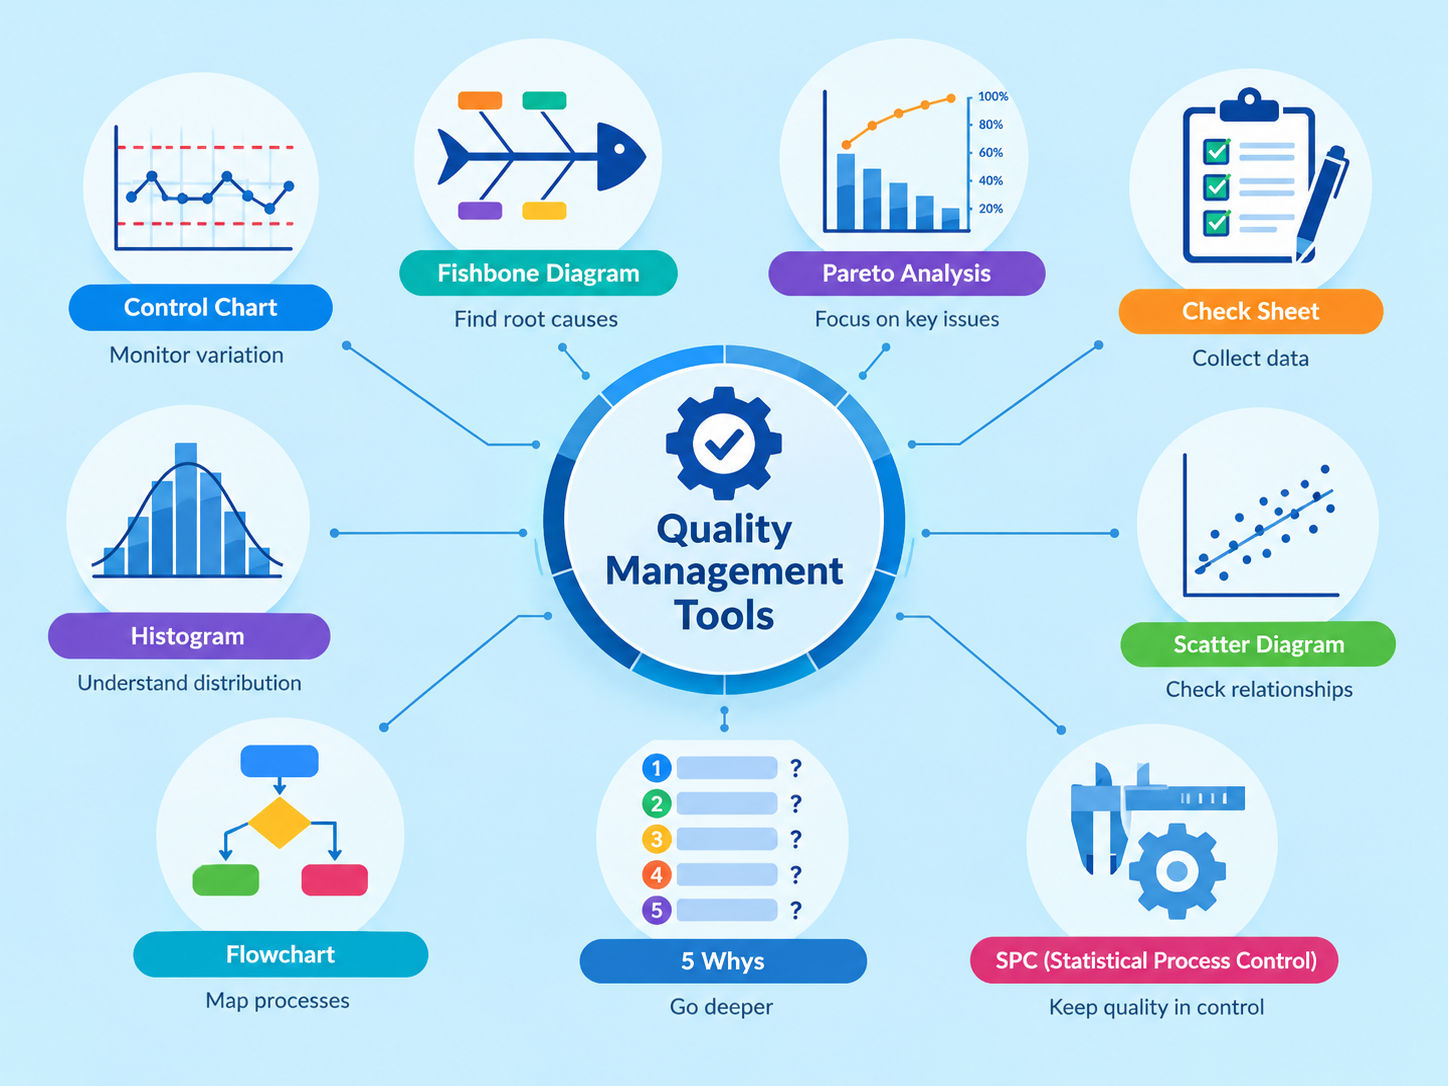
Common examples include:
Some tools focus on data, while others help with problem-solving, risk prevention, or continuous improvement.
For example, a team may use a check sheet to record defects, a Pareto chart to find the most common issue, and a fishbone diagram to explore its causes.
The right quality management tools and techniques depend on the problem, available data, and desired result. No single tool works for every quality issue.
Management Courses to upskill
Explore Management Courses for Career Progression
IIIT-B & IIM, Udaipur
Chief Technology Officer & AI Leadership ProgrammeIIM Kozhikode
PCP in AI for Business ProfessionalsDifferent quality problems require different approaches. Some tools help teams identify an issue, while others help them understand causes, monitor performance, or prevent future failures.
When the problem is not fully understood, teams can begin their analysis using quality tools such as:
Check sheet: A simple data collection tool that can be used to record the frequency of various problems, defects, or events.
Pareto chart: A bar graph that helps to identify the most frequent categories of problems or defects in the process.
Flowchart: A diagram that schematically represents the sequence of process steps in order to identify where the problems occur.
For example, a service team can apply a check sheet to log the customers’ complaints and then build a Pareto chart to prioritize the most common complaints.
Once the cause of a problem has been determined, the next step is to ascertain why. There are several quality management tools and techniques that can help the process.
Fishbone diagram: This organizes possible causes into groups
5 Whys: It helps team members to repeatedly ask why a problem occurred.
Scatter diagram: This helps to assess whether there is a relationship between two variables.
These tools and techniques can assist a project team in getting beyond first level causes and move to deeper ones
Some processes need continuous monitoring rather than occasional checks.
These approaches can help teams recognise unusual changes before they result in significant quality failures.
When the organization’s aim is to continuously improve business processes, different quality management approaches may be used, including:
PDCA: a method allowing to plan, implementing, and auditing changes;
Kaizen: to achieve gradual and incremental improvements
Benchmarking: the process of comparing indicators and methods with those in other organizations or developed standards.
Overall, these concepts are similar because they are aimed at improving performance, increasing quality, and ensuring that changes are made in an ongoing basis, not as one-time projects.
Also Read: Top 15 Benefits of Total Quality Management (TQM) for Business Success
Preventing problems can be more effective than trying to solve them after they happen.
FMEA: Detects possible failures and evaluates the effect that they could have.
Risk assessment matrix: Compares different risks by considering factors, such as the likelihood and the impact of these risks.
By employing quality management tools and techniques, the organisation will be able to prevent any potential issues in relation to customers or the company's own processes.
Choosing a quality tool should begin with the problem rather than the tool itself. Teams should first understand what they are trying to achieve.
A practical selection process includes:
Quality Tool Selection Guide:
Objective |
Recommended Tool |
| Find root cause | Fishbone, 5 Whys |
| Prioritise issues | Pareto Chart |
| Track variation | Control Chart |
| Collect information | Check Sheet |
| Understand distribution | Histogram |
| Map a process | Flowchart |
| Prevent potential failures | FMEA |
| Drive continuous improvement | PDCA, Kaizen |
A combination of tools may sometimes provide better results than using one method alone. For instance, a team could use a flowchart to understand a process, a check sheet to collect defect data, and a Pareto chart to prioritize the main issue.
Also Read: Basic Components of Supply Chain Management
The benefits of using quality management tools include providing teams with the much-needed perspective that allows them to differentiate between the current processes and those that should exist, enabling the former to identify areas for improvement. Additionally, using such tools helps people base their quality management decisions on objective data.
Quality management tools can aid organizations in recognizing patterns in errors, defects, delays, and other problems that occur in their day-to-day operations. Doing so helps project managers and teams identify points that require improvement and address them accordingly.
The use of such tools as fishbone diagrams and the 5 Whys technique helps the team look beyond the first apparent cause and identify the underlying ones. This approach allows the team to determine the root causes to be able to address them.
When the sources of errors and inefficiencies are eliminated, fewer products need to be rejected, and there will be less rework and wasted materials and time.
Also read: Top 5 Project Management Tools in 2026
In addition, quality tools also help organizations in maintaining the processes. For example, control charts were used to indicate certain unusual changes that may require investigation so that any future occurrence of the cause can be prevented.
Making quality decisions requires good information. By providing executive and line managers with information needed to evaluate and compare alternatives, quality tools help in decision making.
Better process control typically results in fewer defects, improved products, and better services, which overall contribute to raising the level of customer satisfaction.
In general, it is essential to make quality management tools a part of a company’s daily operations to ensure that they are used regularly and routinely in order to identify areas of improvement and implement necessary changes.
Also read: Top 4 Functions of Management Process Explained
The examples of industries where quality management tools can and are being applied go far beyond manufacturers. These tools can be implemented in various other fields of activity to address specific process quality issues and mitigate associated risks.
It is common for manufacturers to deal with quality control issues such as defects and inconsistencies, malfunctioning equipment, poor raw materials, and inefficient production. In this setting, control charts can be used to track and study process variations, while Pareto analysis can identify the most common defects in a product. On the other hand, fishbone diagrams can be utilized to establish potential causes of defects, and FMEA can mitigate the occurrence of potential failures during the design stage.
Healthcare organizations can utilize check sheets to record incidents or process errors. Flowcharts can be used in the process of identifying the causes of delays or elimination of extra steps and accordingly, patient-related processes can be mapped down.
Root cause analysis can be used to analyze why a certain event might have occurred.
Software teams can apply process mapping to understand development and delivery workflows. Pareto analysis can help identify recurring defect categories. PDCA can support continuous improvement, while defect tracking systems provide information that teams can analyse to improve software quality.
Construction projects involve multiple activities, teams, suppliers, and potential risks. Checklists can help teams verify quality requirements at different stages.
Cause-and-effect diagrams can support investigations into defects, while FMEA can help identify possible project or process failures. Control charts may also be useful for suitable measurable processes.
Service organisations can analyse customer feedback to identify recurring problems. Pareto charts can help prioritise the most frequent complaints.
Process mapping can highlight delays or unnecessary steps, while quality checklists can help employees maintain consistent service standards.
Across these sectors, the specific tools may differ, but the underlying purpose remains similar: understand performance, identify problems, and make improvements based on evidence.
Also read: Top Productivity Hacks to Boost Efficiency and Success
Using quality management tools effectively requires more than simply knowing how each tool works. The following practices can help teams apply them correctly and get better results from quality improvement efforts.
Quality management tools help organisations spot problems, understand processes, and improve quality. The 7 basic tools of quality management provide simple ways to collect data, find causes, and monitor performance.
Other quality management tools and techniques and total quality management tools can support risk prevention and continuous improvement. The key is to choose the right tool for the problem, use reliable data, and check whether the solution actually works.
Ready to start your journey? Book a free consultation with upGrad today to find the best path for your career.
Quality management tools are practical methods that help organisations understand and improve how work is performed. They can be used to organise information, study process performance, plan improvements, and support better quality decisions. The right tool depends on the type of problem and the information available.
The five core quality tools commonly used in the automotive industry are APQP, FMEA, MSA, SPC, and PPAP. Together, they support quality planning, risk analysis, measurement-system evaluation, process control, and production-part approval. They are mainly associated with automotive product and manufacturing quality requirements.
The New 7 QC Tools are designed mainly for planning, organising ideas, and solving complex problems where information may not be purely numerical. They include affinity diagrams, relations diagrams, tree diagrams, matrix diagrams, matrix data analysis, arrow diagrams, and PDPC.
The term “5 management tools” can refer to different sets depending on the quality framework being discussed. In the context of the New 7 QC Tools, management tools are generally used to organise ideas, examine relationships, structure decisions, plan actions, and manage complex quality-related situations.
The seven steps commonly used in a quality improvement process are identifying the problem, collecting data, analysing causes, developing solutions, implementing changes, monitoring results, and standardising successful improvements. These steps create a practical cycle for solving quality issues and preventing them from recurring.
The traditional 7 QC tools mainly work with numerical data and help teams analyse existing quality problems. The New 7 QC Tools focus more on planning, organising ideas, relationships, decision-making, and complex problems. In practice, organisations can use both sets at different stages of improvement.
The New 7 QC Tools are particularly useful when teams need to organise ideas, compare alternatives, understand relationships, or plan actions. Affinity diagrams can group related ideas, while tree diagrams, matrix diagrams, and prioritisation methods can help structure complex information and support clearer decisions.
No. Quality management tools can be used in manufacturing as well as healthcare, software, construction, education, logistics, and service businesses. The specific method may change depending on the process, but the broader goal remains the same: understand performance, manage problems, and improve how work is delivered.
Quality management tools are often used within Six Sigma projects to understand process problems and support data-based improvement. For example, teams may use charts, process analysis, and root-cause methods during different stages of a Six Sigma project. The tools themselves are not limited to Six Sigma.
Yes. Quality management tools can support activities within an ISO 9001-based quality management system, although ISO 9001 does not require organisations to use one fixed set of tools. Companies can select methods that suit their processes, risks, objectives, monitoring needs, and improvement activities.
Start with the type of information you have and the question you need to answer. If the issue is unclear, begin by gathering and organising information. For complex problems, planning or relationship-based tools may help before moving into detailed analysis or corrective action.
698 articles published
Sriram K is a Senior SEO Executive with a B.Tech in Information Technology from Dr. M.G.R. Educational and Research Institute, Chennai. With over a decade of experience in digital marketing, he specia...
Get Free Consultation
By submitting, I accept the T&C and
Privacy Policy
Top Resources
Certification
3 Months
Certification
6 Months
O.P. Jindal Global University
Masters in International Accounting and Finance (Accredited by ACCA, UK)Master's Degree
12 Months