Capital Budgeting Techniques: Types, Formula, Examples, Advantages, and Comparison
By upGrad
Updated on Aug 06, 2026 | 4 min read | 1.46K+ views
Share:

All courses
Certifications
More
By upGrad
Updated on Aug 06, 2026 | 4 min read | 1.46K+ views
Share:
Table of Contents
Key Highlights
Advance your financial expertise with upGrad's MBA course. Master investment analysis, capital budgeting, and strategic decision-making.
Popular upGrad Programs
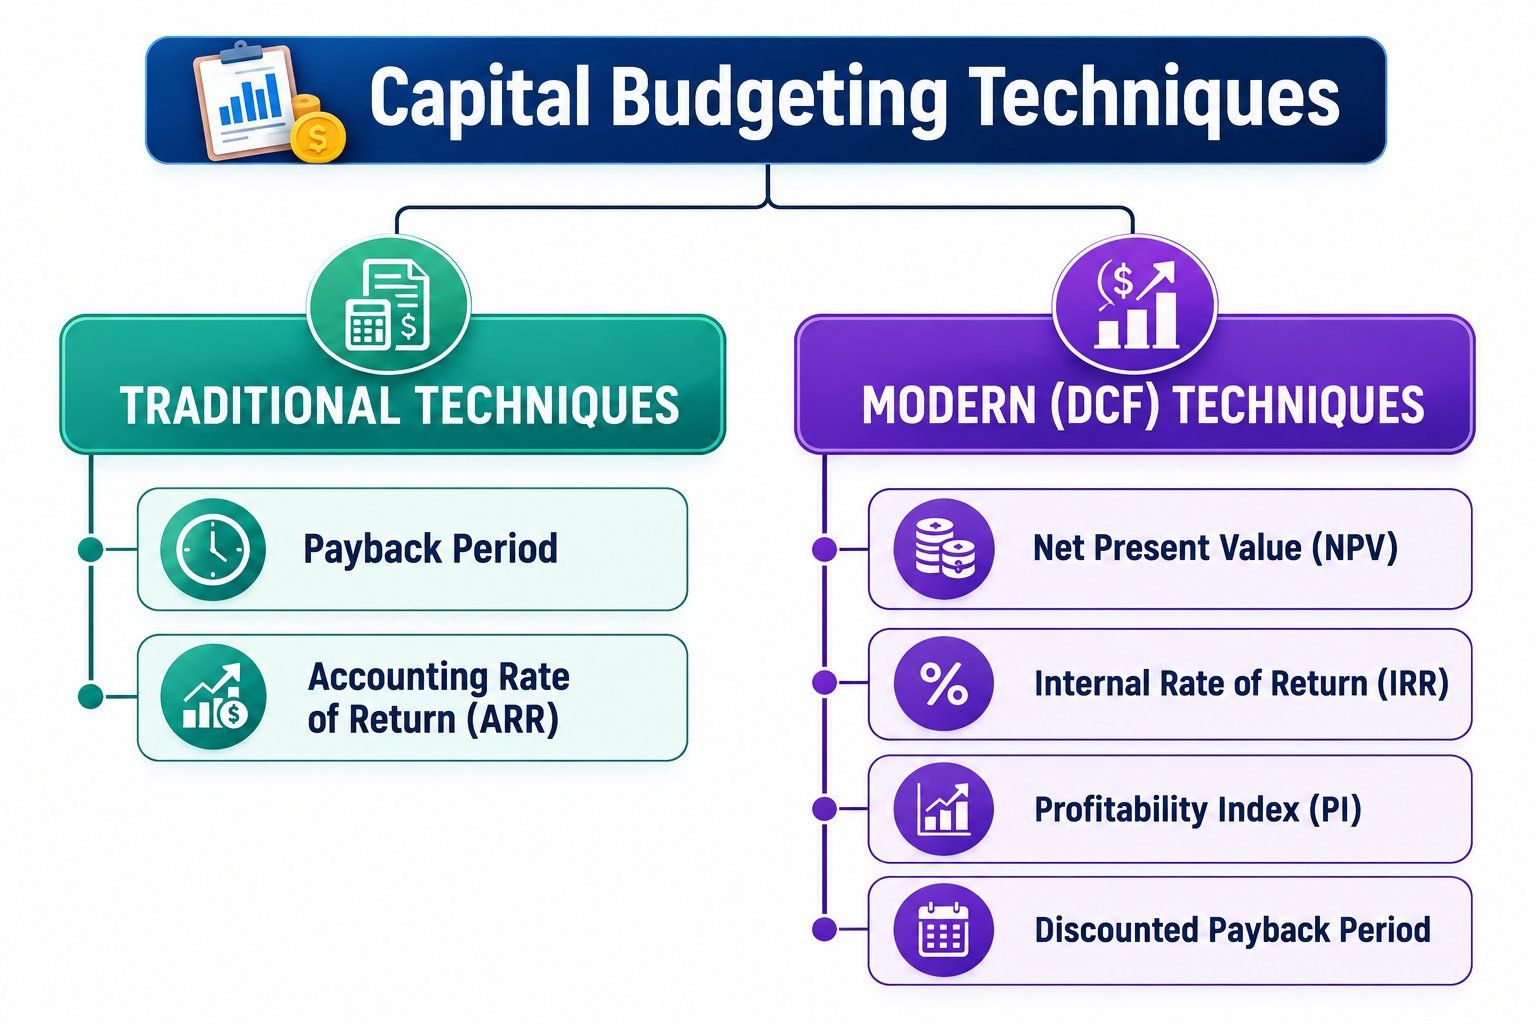
Organizations use various techniques of capital budgeting to determine whether a long-term investment will generate sufficient returns. These methods fall into two broad categories:
The table below summarizes the major techniques.
Category |
Capital Budgeting Technique |
Considers Time Value of Money |
Best Used For |
| Traditional | Payback Period | No | Measuring investment recovery time |
| Traditional | Accounting Rate of Return (ARR) | No | Evaluating accounting profitability |
| Modern (DCF) | Net Present Value (NPV) | Yes | Maximizing shareholder value |
| Modern (DCF) | Internal Rate of Return (IRR) | Yes | Comparing project returns |
| Modern (DCF) | Profitability Index (PI) | Yes | Ranking projects with limited capital |
| Modern (DCF) | Discounted Payback Period | Yes | Measuring discounted recovery period |
Traditional techniques are simple, easy to calculate, and commonly used for preliminary investment analysis. Since they ignore the time value of money, organizations often combine them with modern methods before making final investment decisions.
The two widely used traditional techniques are:
Modern capital budgeting techniques use the Discounted Cash Flow (DCF) approach, which recognizes that money received today is worth more than the same amount received in the future.
These techniques provide a more reliable basis for evaluating long-term investments because they account for factors such as inflation, investment risk, and opportunity cost.
The most commonly used DCF techniques include:
Free Courses
Each capital budgeting technique evaluates an investment from a different perspective. The sections below explain how these methods work, along with their formulas, calculations, practical examples, advantages, and limitations to help you choose the most suitable approach for long-term investment decisions.
The Payback Period measures the amount of time required to recover the initial investment from a project's cash inflows. It is one of the simplest capital budgeting techniques and is often used by businesses that prioritize liquidity or want to recover their investment quickly.
For projects with consistent annual cash inflows, the payback period is easy to calculate. If cash inflows vary each year, the cumulative cash flow method is used to determine when the initial investment is fully recovered.
Formula
[
\text{Payback Period}=\frac{\text{Initial Investment}}{\text{Annual Cash Inflow}}
]
Calculation
Suppose a company invests ₹10,00,000 in new manufacturing equipment that generates ₹2,50,000 every year.
[
\text{Payback Period}=\frac{10,00,000}{2,50,000}=4 \text{ years}
]
The investment will recover its original cost in 4 years.
Example
A retail chain plans to install automated billing systems in all its stores for ₹20 lakh. The project is expected to save ₹5 lakh annually in labor costs.
Since the investment is recovered in four years, management can compare this recovery period with its internal benchmark. If the company requires investments to recover within five years, the project qualifies for further evaluation.
Advantages
Limitations
The Accounting Rate of Return (ARR) evaluates an investment based on its average accounting profit rather than cash inflows. It expresses profitability as a percentage of the average investment and is often used to compare projects with similar investment sizes.
Unlike DCF techniques, ARR relies on accounting income reported in financial statements, making it useful for assessing profitability from an accounting perspective.
Formula
[
\text{ARR}=\left(\frac{\text{Average Annual Profit}}{\text{Average Investment}}\right)\times100
]
Calculation
A company invests ₹8,00,000 in production equipment.
[
\text{ARR}=\left(\frac{1,60,000}{4,00,000}\right)\times100=40%
]
The project generates an Accounting Rate of Return of 40%.
Example
A pharmaceutical company is considering purchasing automated packaging machinery. The investment is expected to improve production efficiency and generate an average annual accounting profit of ₹12 lakh.
If the company's minimum acceptable ARR is 30% and the project achieves 35%, it may be considered financially attractive, subject to further evaluation using other capital budgeting techniques.
Advantages
Limitations
Net Present Value (NPV) is one of the most reliable capital budgeting techniques because it measures the difference between the present value of future cash inflows and the initial investment. It recognizes the time value of money, which means money received today is more valuable than the same amount received in the future.
A positive NPV indicates that a project is expected to create value for the business, while a negative NPV suggests the investment may not generate sufficient returns.
Formula
[
\text{NPV}=\sum_{t=1}^{n}\frac{CF_t}{(1+r)^t}-\text{Initial Investment}
]
Where:
Calculation
A company plans to invest ₹10,00,000 in a new production line.
The present value of all future cash inflows equals ₹11,37,236.
[
\text{NPV}=11,37,236-10,00,000=₹1,37,236
]
Since the NPV is positive, the project is expected to add value and is financially acceptable.
Example
A logistics company is evaluating whether to automate its warehouse operations. The investment requires ₹50 lakh upfront and is projected to reduce operating costs over the next seven years.
After discounting the expected savings at the company's required rate of return, the project produces a positive NPV. This indicates the automation project is likely to generate returns above the company's cost of capital.
Advantages
Limitations
Decision Rule
NPV Result |
Decision |
| Positive (>0) | Accept the project |
| Zero (=0) | Financially indifferent |
| Negative (<0) | Reject the project |
The Internal Rate of Return (IRR) represents the discount rate at which a project's NPV becomes zero. In simple terms, it shows the annual rate of return an investment is expected to generate.
Businesses compare the IRR with their required rate of return or cost of capital. Projects with an IRR higher than the required return are generally considered worthwhile.
Formula
IRR is the discount rate that satisfies:
[
0=\sum_{t=1}^{n}\frac{CF_t}{(1+IRR)^t}-\text{Initial Investment}
]
Unlike the Payback Period or ARR, IRR is usually calculated using financial calculators, Excel, or financial software because it requires iterative computation.
Calculation
A company invests ₹15,00,000 in a project.
Since 16% > 12%, the project meets the company's investment criteria.
Example
An automobile manufacturer is deciding whether to establish a new assembly plant. Financial analysis estimates the project will generate an IRR of 18%, while the company's hurdle rate is 14%.
Because the expected return exceeds the minimum required return, the investment becomes a strong candidate for approval.
Advantages
Limitations
Decision Rule
IRR Result |
Decision |
| IRR > Required Return | Accept |
| IRR = Required Return | Neutral |
| IRR < Required Return | Reject |
The Profitability Index (PI) measures the value created for every rupee invested. It is especially useful when businesses have limited capital and need to rank multiple investment opportunities.
A higher profitability index indicates a better return relative to the investment cost.
Formula
[
\text{PI}=\frac{\text{Present Value of Future Cash Inflows}}{\text{Initial Investment}}
]
Calculation
A company invests ₹20,00,000.
Present value of future cash inflows = ₹24,00,000
[
PI=\frac{24,00,000}{20,00,000}=1.20
]
A PI greater than 1 indicates the investment is expected to create value.
Example
A software company has funding for only one of three proposed AI development projects. Management calculates the profitability index for each project and prioritizes the one with the highest PI because it delivers the greatest value per rupee invested.
Advantages
Limitations
Decision Rule
Profitability Index |
Decision |
| PI > 1 | Accept |
| PI = 1 | Neutral |
| PI < 1 | Reject |
The Discounted Payback Period improves the traditional payback method by considering the time value of money. Instead of using actual cash inflows, it uses discounted cash inflows to determine how long it takes to recover the initial investment.
This makes it a more realistic measure of investment recovery.
Formula
There is no single direct formula.
The discounted payback period is determined by:
Calculation
A company invests ₹10,00,000.
The discounted cash inflows are:
Year |
Discounted Cash Flow (₹) |
Cumulative Cash Flow (₹) |
| 1 | 2,20,000 |
2,20,000 |
| 2 | 2,05,000 |
4,25,000 |
| 3 | 1,90,000 |
6,15,000 |
| 4 | 1,75,000 |
7,90,000 |
| 5 | 1,65,000 |
9,55,000 |
| 6 | 1,50,000 |
11,05,000 |
The investment is recovered during the sixth year, making the discounted payback period approximately 5.3 years.
Example
An energy company plans to install solar panels across its facilities. Since future energy savings occur over many years, management discounts each year's projected savings before determining how long the investment takes to recover its cost.
This approach provides a more accurate assessment than the traditional payback period.
Advantages
Limitations
Recommended Courses to upskill
Explore Our Popular Courses for Career Progression
IIIT Bangalore
Executive Diploma in Machine Learning and AI360° Career Support
O.P.Jindal Global University
MBA from O.P.Jindal Global UniversityLive Case Studies and Projects
Every capital budgeting technique evaluates an investment from a different perspective. Some focus on recovering the initial investment quickly, while others measure profitability or the value a project creates over its lifetime. Understanding these differences helps businesses select the most appropriate method for a given investment decision.
The following comparison summarizes the key characteristics of each technique.
Technique |
Formula |
Time Value of Money |
Decision Rule |
Advantages |
Limitations |
Best Use Case |
| Payback Period | Initial Investment ÷ Annual Cash Inflow | No | Shorter payback is preferred | Easy to calculate, focuses on liquidity | Ignores profitability after payback | Projects requiring quick recovery |
| ARR | Average Annual Profit ÷ Average Investment × 100 | No | Higher ARR is preferred | Uses accounting data, easy to understand | Ignores cash flows and time value | Comparing accounting profitability |
| NPV | Present Value of Cash Inflows − Initial Investment | Yes | Accept if NPV > 0 | Measures value creation | Requires accurate discount rate | Long-term strategic investments |
| IRR | Discount rate where NPV = 0 | Yes | Accept if IRR exceeds required return | Easy project comparison | Multiple IRRs may occur | Comparing investment returns |
| Profitability Index | Present Value of Cash Inflows ÷ Initial Investment | Yes | Accept if PI > 1 | Useful during capital rationing | Less suitable for mutually exclusive projects | Limited investment budgets |
| Discounted Payback Period | Based on cumulative discounted cash flows | Yes | Shorter discounted payback is preferred | Considers time value while measuring recovery | Ignores cash flows after recovery | Long-term projects with cash flow risk |
NPV, IRR, and Payback Period are among the most widely used capital budgeting techniques, but each answers a different business question.
Criteria |
NPV |
IRR |
Payback Period |
| Measures | Value created | Percentage return | Recovery time |
| Time Value of Money | Yes | Yes | No |
| Cash Flows Considered | Entire project life | Entire project life | Until investment is recovered |
| Best For | Maximizing shareholder wealth | Comparing project returns | Measuring liquidity |
| Preferred By | Corporate finance teams | Investors and analysts | Small businesses and preliminary screening |
Traditional and modern techniques serve different purposes. Traditional methods of capital budgeting are easier to calculate and understand, while modern techniques of capital budgeting provide a more comprehensive financial evaluation.
Feature |
Traditional Techniques |
Modern (DCF) Techniques |
| Techniques | Payback Period, ARR | NPV, IRR, PI, Discounted Payback |
| Time Value of Money | Not considered | Considered |
| Accuracy | Moderate | High |
| Complexity | Low | Moderate to High |
| Cash Flow Analysis | Limited | Comprehensive |
| Suitable For | Initial project screening | Final investment decisions |
Although modern techniques require more calculations, they provide a clearer picture of an investment's profitability and long-term impact. As a result, most large organizations rely on DCF-based methods for major capital expenditure decisions.
Ready to accelerate your leadership journey? Enroll in upGrad's MBA from LBS with IIMU Certification and build expertise in business strategy, financial management, and leadership for global career growth.
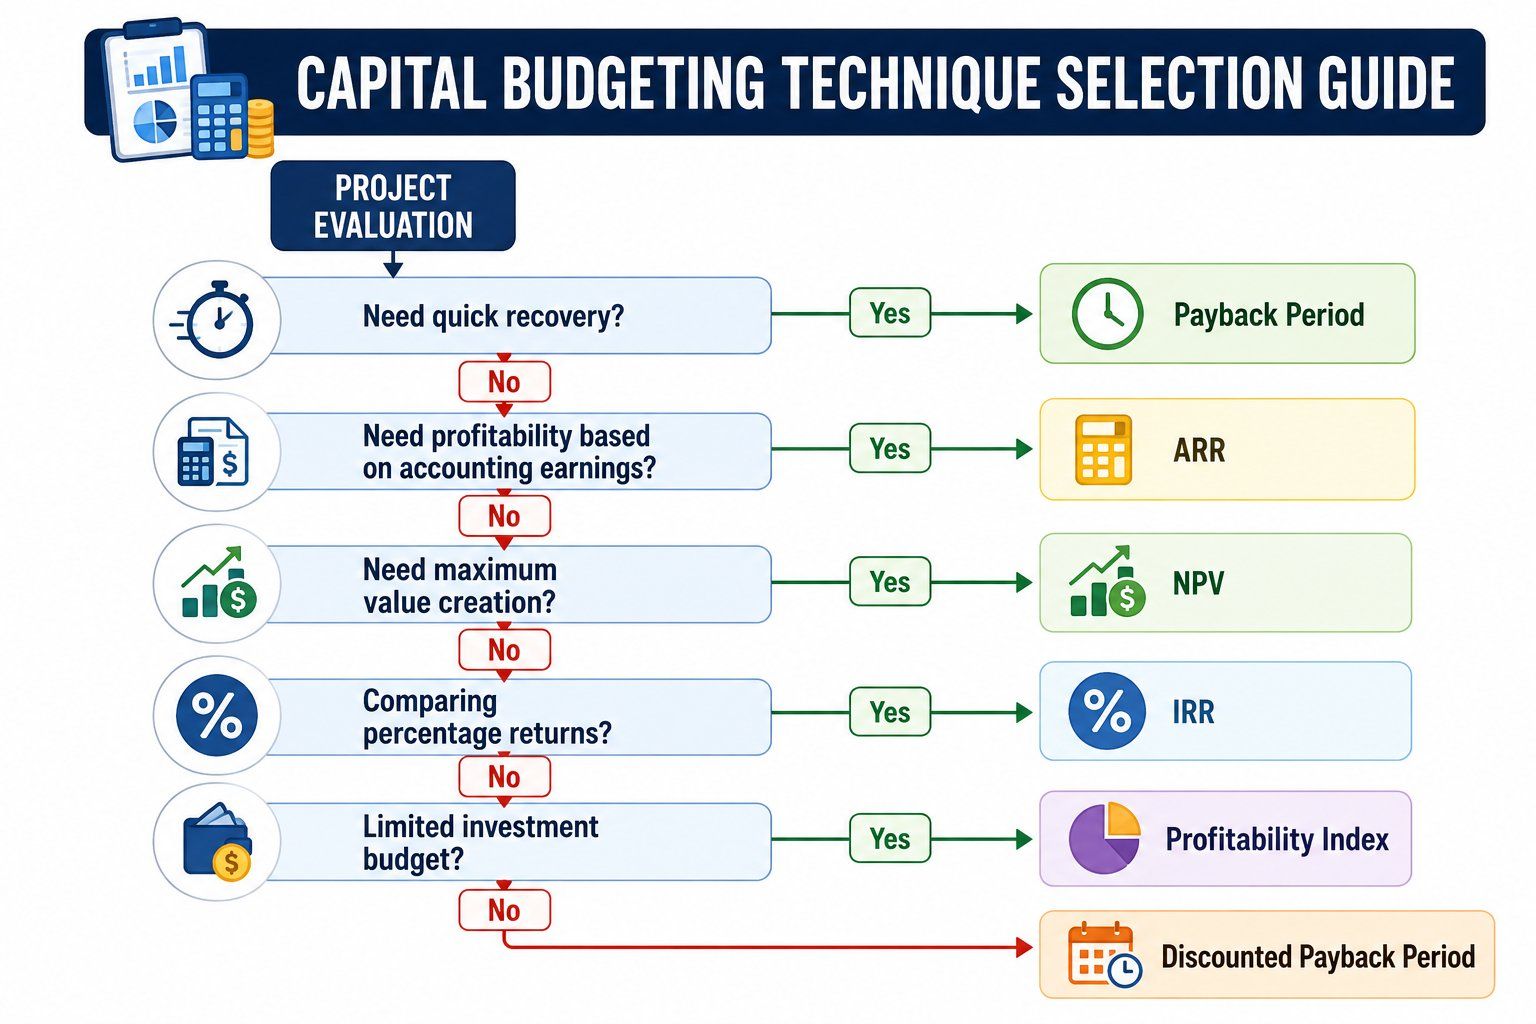
There is no universal technique that works for every investment. The right choice depends on the project's objectives, financial constraints, and level of uncertainty. Businesses often combine multiple methods to make balanced investment decisions.
Large capital-intensive projects involve substantial financial commitments and longer payback periods. Since these projects have a significant impact on business performance, techniques that evaluate the complete cash flow stream are more appropriate.
Recommended techniques
Smaller projects with limited investment requirements can often be evaluated using simpler techniques during the initial screening stage.
Projects with stable and predictable cash inflows are easier to evaluate using traditional techniques.
When cash flows fluctuate significantly from year to year, discounted cash flow methods provide a more accurate assessment because they account for both timing and value.
Projects in industries such as renewable energy, technology, pharmaceuticals, or infrastructure often involve uncertain future cash flows.
In these situations, businesses typically prefer:
These methods provide a better understanding of investment risk than traditional techniques.
Companies rarely have unlimited investment funds. When multiple profitable projects compete for limited capital, prioritization becomes essential.
The Profitability Index (PI) helps rank projects according to the value generated for every unit of investment, making it particularly useful during capital rationing.
Different investment goals call for different evaluation techniques.
Business Objective |
Recommended Technique |
| Recover investment quickly | Payback Period |
| Measure accounting profitability | ARR |
| Maximize company value | NPV |
| Compare investment returns | IRR |
| Rank projects with limited capital | PI |
| Evaluate discounted recovery | Discounted Payback Period |
Even the most reliable evaluation method can produce misleading results when assumptions or calculations are inaccurate. Recognizing common mistakes helps businesses improve investment decisions and reduce financial risk.
Using only traditional techniques such as the Payback Period or ARR for large projects may overlook the impact of future cash flows. Combining them with DCF techniques provides a more balanced evaluation.
Overestimating future revenue or underestimating operating expenses can make a project appear more attractive than it actually is. Reliable forecasting based on historical data and market analysis leads to better investment decisions.
The discount rate directly influences NPV, PI, and Discounted Payback calculations. A rate that is too high or too low may significantly alter project outcomes.
Inflation affects purchasing power, while taxes influence actual project returns. Including these factors produces more realistic financial projections.
Unexpected market conditions, technological changes, regulatory updates, or supply chain disruptions can impact project performance. Risk assessment should accompany every capital budgeting analysis.
Each method highlights a different aspect of investment performance.
For example:
Using multiple techniques provides a more comprehensive investment assessment.
Successful investment decisions require more than calculating financial metrics. A structured evaluation process of capital budgeting improves decision quality and reduces uncertainty.
Capital budgeting techniques provide a structured framework for evaluating long-term investment opportunities. While traditional methods of capital budgeting such as the Payback Period and Accounting Rate of Return offer quick insights into investment recovery and accounting profitability, modern DCF techniques like NPV, IRR, Profitability Index, and Discounted Payback Period deliver a more comprehensive assessment by considering the time value of money.
The most effective investment decisions rarely depend on a single technique. Organizations often combine multiple methods to evaluate liquidity, profitability, risk, and value creation before committing capital. Selecting the right technique based on project size, cash flow patterns, available capital, and business objectives leads to better resource allocation and stronger long-term financial performance.
Ready to start your journey? Book a free consultation with upGrad today to find the best path for your career.
The five steps of capital budgeting are identifying investment opportunities, estimating future cash flows, evaluating projects using capital budgeting techniques, selecting the most suitable investment, and reviewing project performance after implementation. This structured process of capital budgeting helps businesses make informed long-term investment decisions.
The first step is identifying potential investment opportunities that align with the organization's strategic goals. These opportunities may include purchasing equipment, expanding operations, launching new products, or upgrading technology to improve efficiency and support long-term growth.
Net Present Value (NPV) is widely regarded as the best capital budgeting method because it considers the time value of money and measures the value a project adds. However, many organizations also use IRR and Payback Period alongside NPV for a more comprehensive evaluation.
Each technique serves a different purpose. NPV measures value creation, IRR calculates the expected rate of return, and Payback Period determines how quickly an investment is recovered. The best choice depends on the project's objectives, and businesses often use these methods together.
Yes. Companies frequently combine techniques such as Payback Period, NPV, IRR, and Profitability Index to evaluate liquidity, profitability, and investment returns. Using multiple methods provides a more balanced assessment and supports better investment decisions.
Inflation reduces the purchasing power of future cash flows and increases project costs over time. Including inflation in financial projections helps businesses estimate future returns more accurately and choose investments that remain profitable under changing economic conditions.
Businesses should review capital budgeting decisions regularly, especially after project completion or when market conditions, interest rates, costs, or expected cash flows change. Periodic reviews help improve forecasting accuracy and support better future investment planning.
A project may fail because of inaccurate cash flow estimates, unrealistic assumptions, cost overruns, changing market demand, poor risk assessment, or unexpected economic conditions. Careful planning, regular monitoring, and realistic financial projections help reduce these risks.
Yes. Startups and small businesses often operate with limited financial resources, making investment decisions critical. Capital budgeting techniques help evaluate project feasibility, prioritize investments, and allocate funds efficiently to support sustainable business growth.
Industries such as manufacturing, construction, energy, healthcare, transportation, telecommunications, retail, and information technology rely heavily on capital budgeting techniques because they regularly invest in expensive assets, infrastructure, and long-term projects.
Yes. Capital budgeting techniques can also evaluate projects such as digital transformation, sustainability initiatives, employee training, or infrastructure improvements by estimating their long-term financial and operational benefits before investment decisions are made.
972 articles published
We are an online education platform providing industry-relevant programs for professionals, designed and delivered in collaboration with world-class faculty and businesses. Merging the latest technolo...
Get Free Consultation
By submitting, I accept the T&C and
Privacy Policy
Top Resources
Certification
3 Months
Certification
6 Months
O.P. Jindal Global University
Masters in International Accounting and Finance (Accredited by ACCA, UK)Master's Degree
12 Months