Price Elasticity of Demand: Formula, Types, Examples and Importance
By upGrad
Updated on Aug 10, 2026 | 193 views
Share:

All courses
Certifications
More
By upGrad
Updated on Aug 10, 2026 | 193 views
Share:
Table of Contents
Key Highlights
Want to build strong business skills and advance your career? Explore our DBA degree program and take the next step toward becoming a business leader.
Price elasticity of demand is a measure of how much the quantity demanded of a product changes when its price changes. It shows how sensitive consumers are to changes in price.
Suppose the price of a movie ticket rises by 10%. If the number of tickets purchased falls by 20%, consumers have responded strongly to the price increase. Demand is relatively elastic.
Now consider electricity. If its price increases by 10% and households reduce their consumption by only 2%, demand is relatively inelastic.
So, the concept is not simply about whether demand increases or decreases. It is about how much demand changes compared with the change in price.
Price affects purchasing decisions because consumers have limited income and choices.
When a product becomes more expensive, some customers may:
The strength of this response depends on the product and the market.
For example, a rise in the price of branded coffee may push some customers toward another brand. A rise in the price of an essential medicine may have a much smaller effect on consumption.
Also read: Law of Demand: Meaning, Examples, Assumptions & Uses
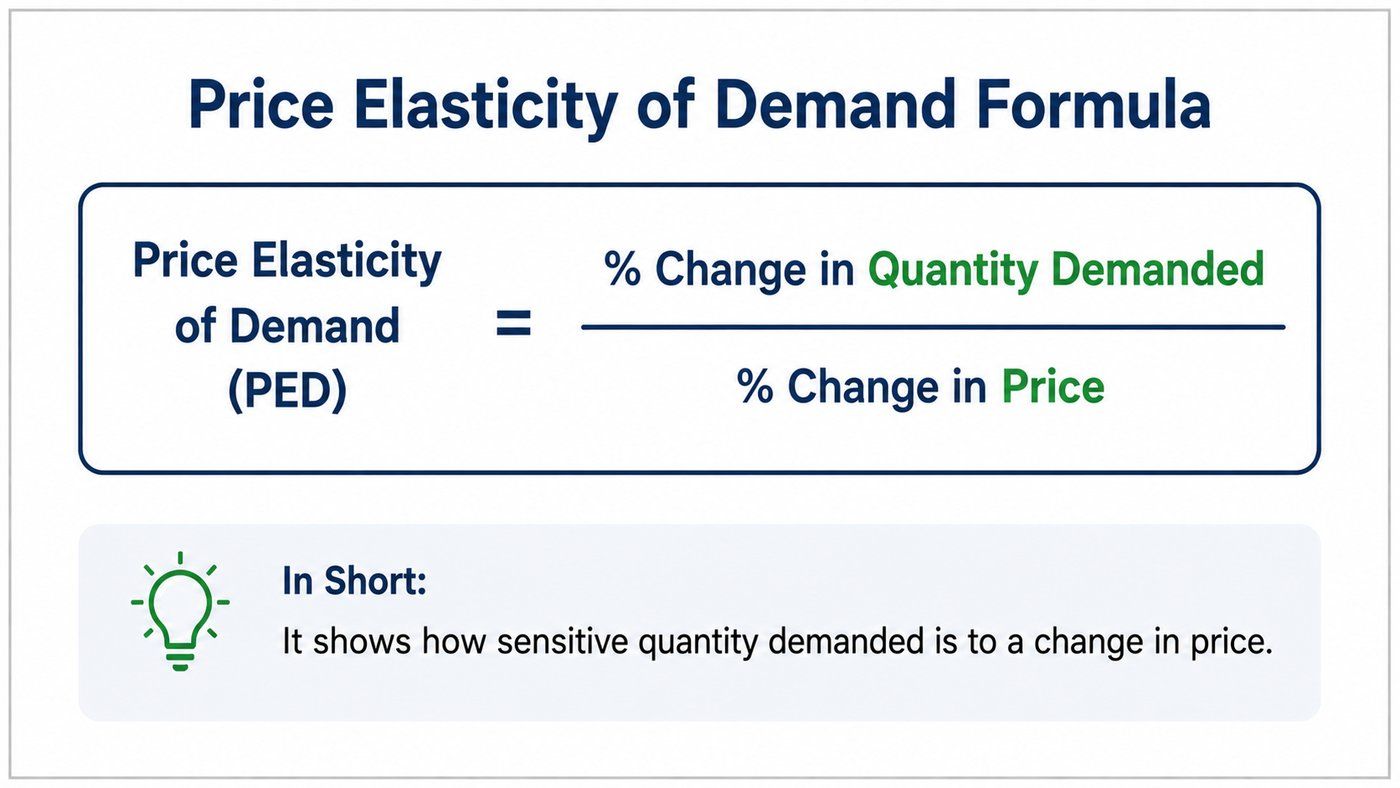
The basic price elasticity of demand formula compares the percentage change in quantity demanded with the percentage change in price.
Price Elasticity of Demand = (% change in quantity demanded) ÷ (% change in price)
For example, suppose the price of a product increases by 20%, while quantity demanded falls by 30%.
PED = -30% / 20% = -1.5
The negative sign shows the inverse relationship between price and quantity demanded.
For classification, economists usually use the absolute value:
|PED| = 1.5
Since 1.5 is greater than 1, demand is elastic.
The price elasticity of demand equation can also be written as:
E_d = (%ΔQ_d) / (%ΔP)
Where:
The equation helps economists compare the size of two percentage changes.
Also read: How To Do Market Research - [Ultimate Guide]
DBA Courses to upskill
Explore DBA Courses for Career Progression
IIIT-B & IIM, Udaipur
Chief Technology Officer & AI Leadership ProgrammeThere is more than one way to calculate elasticity. The method depends on the information you have and what you want to measure.
The three common methods are:
Let us understand each one.
The percentage method is the easiest place to start. It uses the basic formula:
PED = % Change in Quantity Demanded / % Change in Price
Let us take an example.
Suppose the price of a notebook increases from ₹100 to ₹110. At ₹100, consumers buy 500 notebooks. After the price increases to ₹110, they buy 450 notebooks. First, calculate the percentage change in price.
The price increases by:
₹110 - ₹100 = ₹10
Percentage change in price:
(₹10 / ₹100) × 100 = 10%
Now calculate the change in quantity demanded.
Quantity falls from 500 to 450.
So:
450 - 500 = -50
Percentage change in quantity demanded:
(-50 / 500) × 100 = -10%
Now apply the formula:
PED = -10% / 10% = -1
The absolute value is 1.
Therefore, demand is unitary elastic.
This example shows why percentage changes are important. The price changed by 10%, and quantity demanded also changed by 10%. The two changes are equal in size.
The point elasticity method measures elasticity at a specific point on a demand curve.
It is useful when you want to know the elasticity for one particular price and quantity combination.
The formula is:
E_d = (dQ / dP) × (P / Q)
Here, dQ/dP represents the change in quantity demanded caused by a small change in price.
You may come across this method when studying a mathematical demand function.
The arc method is useful when you are comparing two points on a demand curve. It is also called the midpoint elasticity method.
Why do we need it?
Suppose a product's price changes from ₹100 to ₹120. Quantity demanded changes from 500 units to 400 units.
You could calculate the percentage change using the original values. But the result can be different if you reverse the direction of the calculation.
The midpoint method solves this problem by using the average of the two prices and the average of the two quantities.
The formula is:
PED = [(Q2 - Q1) / ((Q1 + Q2) / 2)] / [(P2 - P1) / ((P1 + P2) / 2)]
Here:
Let us break it down.
Suppose:
First, find the average quantity:
(500 + 400) / 2 = 450
The change in quantity is:
400 - 500 = -100
So, the percentage change in quantity is:
(-100 / 450) × 100 = -22.22%
Now find the average price:
(₹100 + ₹120) / 2 = ₹110
The price change is:
₹120 - ₹100 = ₹20
Therefore:
(₹20 / ₹110) × 100 = 18.18%
Now calculate elasticity:
PED = -22.22% / 18.18% = -1.22
The absolute value is approximately 1.22.
Since it is greater than 1, demand is elastic.
The midpoint method is particularly useful when a question gives you two prices and two quantities and asks you to calculate elasticity between them.
Let us work through one complete example.
A clothing store sells jackets for ₹2,000 each.
At this price, it sells 1,000 jackets per month.
The store reduces the price to ₹1,800. Monthly sales increase to 1,200 jackets.
We want to calculate the elasticity of demand.
Since we have two prices and two quantities, the midpoint method is suitable.
1,200 - 1,000 = 200
Average quantity:
(1,000 + 1,200) / 2 = 1,100
Percentage change in quantity:
(200 / 1,100) × 100 = 18.18%
₹1,800 - ₹2,000 = -₹200
Average price:
(₹2,000 + ₹1,800) / 2 = ₹1,900
Percentage change in price:
(-₹200 / ₹1,900) × 100 = -10.53%
PED = 18.18% / -10.53% = -1.73
Now ignore the negative sign for classification:
|PED| = 1.73
Since 1.73 is greater than 1, the demand is elastic.
What does this result tell us?
A 10.53% fall in price produced an 18.18% increase in quantity demanded.
The response in quantity was therefore larger than the price change.
That is the key idea behind elasticity.
You do not need to memorise the example. Focus on the process:
Find the percentage change in quantity → Find the percentage change in price → Divide the two → Interpret the result.
Once this becomes familiar, questions involving the price elasticity of demand formula become much easier to solve.
Also read: Difference Between Individual Demand and Market Demand Explained
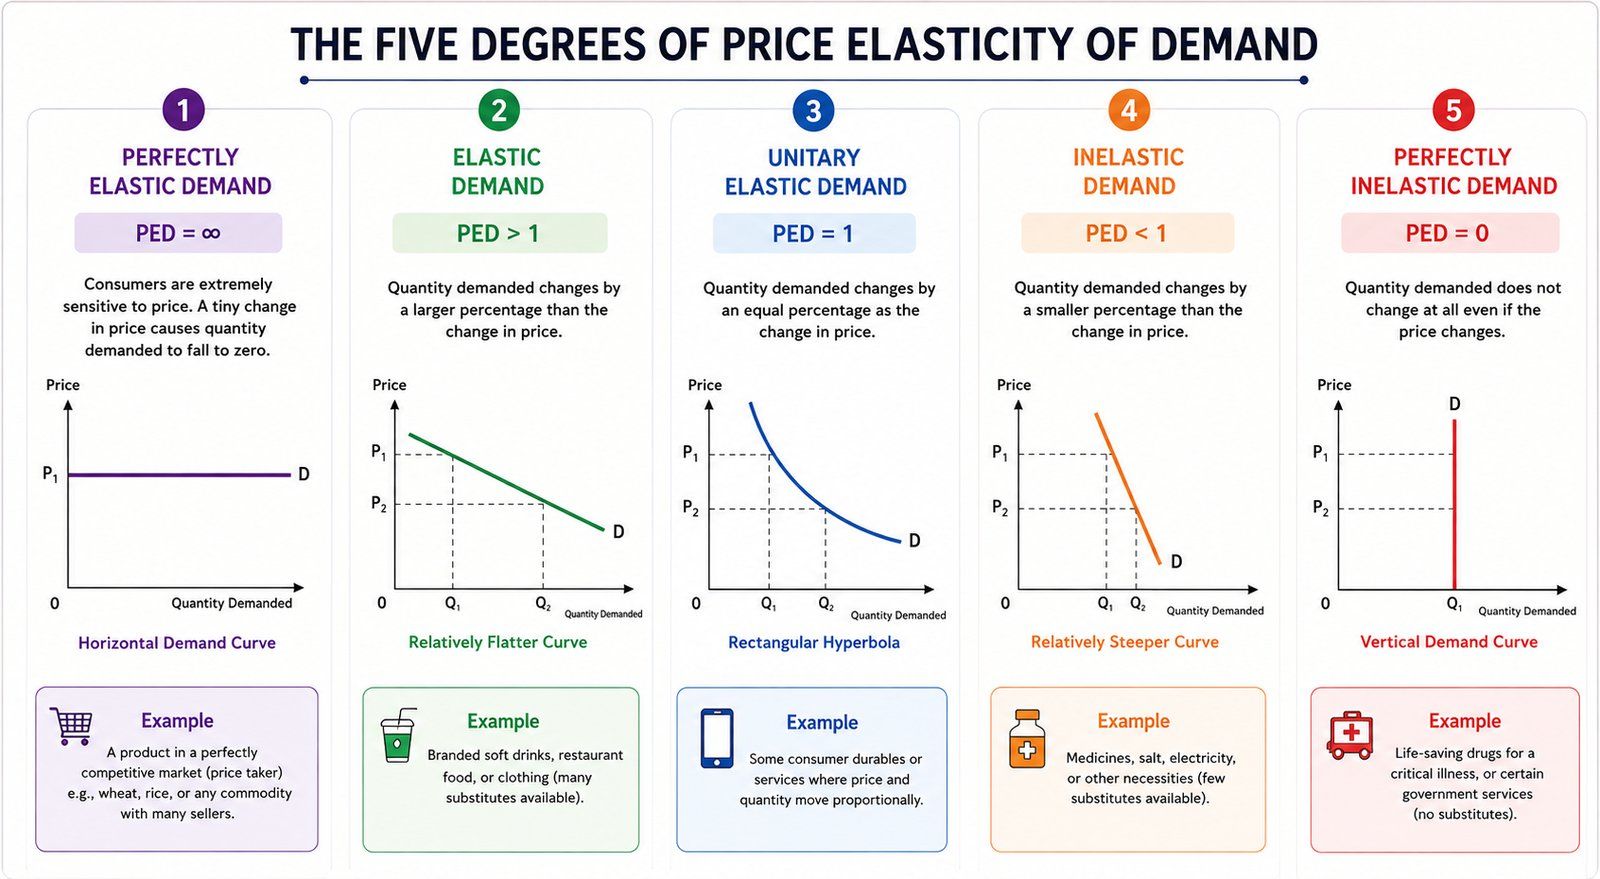
Now that you know how to calculate elasticity, the next step is to understand what the result actually means. The value of elasticity tells us how strongly quantity demanded responds to a change in price. The following are the five main types of price elasticity of demand:
Perfectly elastic demand occurs when consumers are extremely sensitive to price. A very small increase in price can cause quantity demanded to fall sharply.
The elasticity value is PED = ∞
The demand curve is horizontal. This is mainly a theoretical case. It helps explain the extreme level of price sensitivity.
Demand is elastic when quantity demanded changes by a greater percentage than price.
The elasticity value is PED > 1
For example, if price rises by 10% and quantity demanded falls by 30%:
PED = -30% / 10% = -3
|PED| = 3
Therefore, demand is elastic.
Products with many substitutes often have elastic demand. Customers can easily switch when the price becomes less attractive.
Demand is unitary elastic when the percentage change in quantity demanded is equal to the percentage change in price.
The elasticity value is PED = 1
For example, Price change = 20%
Quantity demanded change = 20%
Therefore:
PED = -20% / 20% = -1
|PED| = 1
This means the two percentage changes are equal.
Demand is inelastic when quantity demanded changes by a smaller percentage than price.
The elasticity value is PED < 1
For example, if price rises by 20% and quantity demanded falls by only 5%:
PED = -5% / 20% = -0.25
|PED| = 0.25
Demand is therefore inelastic.
Necessities often have relatively inelastic demand because consumers may continue buying them even after a price increase.
Perfectly inelastic demand occurs when quantity demanded does not change at all when price changes.
The elasticity value is PED = 0
The demand curve is vertical. This is mostly a theoretical situation. It represents the lowest possible level of price responsiveness.
Quick Comparison of the Degrees of Elasticity
Also read: Consumer Behavior in Marketing: Understanding the Psychology
A price elasticity of demand graph shows how quantity demand responds to changes in price. Price is usually placed on the vertical axis, while quantity demanded is placed on the horizontal axis.
The shape of the demand curve helps us visualise the degree of responsiveness.
An elastic demand curve is relatively flatter. A small price change can cause a larger percentage change in quantity demanded. This often happens when consumers have several substitutes.
For example, if one juice brand increases its price, customers can quickly switch to another brand.
An inelastic demand curve is relatively steeper. Quantity demanded changes by a smaller percentage than price. Essential products often show this behaviour. Consumers may continue buying them despite a price increase.
However, inelastic demand does not mean demand stays completely unchanged.
In unitary elastic demand, the percentage change in quantity demanded equals the percentage change in price.
The value is PED = 1
This type is important when studying total revenue because total revenue generally remains unchanged when price changes along a unitary elastic demand curve.
These are the two extreme cases.
Perfectly elastic demand PED = ∞
The curve is horizontal. A small price increase can cause a very large fall in quantity demanded.
Perfectly inelastic demand PED = 0
The curve is vertical. Quantity demanded remains unchanged even when price changes.
Also read: 16+ Types of Demand Forecasting Techniques and Methods
The same price change can affect different products in very different ways. A 10% increase may have little effect on one product but cause a large fall in demand for another.
Why does this happen?
The answer lies in several factors that influence how easily consumers can change their buying behavior.
Take your business career to the next level with a Doctor of Business Administration from Edgewood University and build advanced expertise for leadership and strategic decision-making.
The concept becomes much easier when you apply it to everyday situations. The following price elasticity of demand examples show how different products can have different levels of responsiveness.
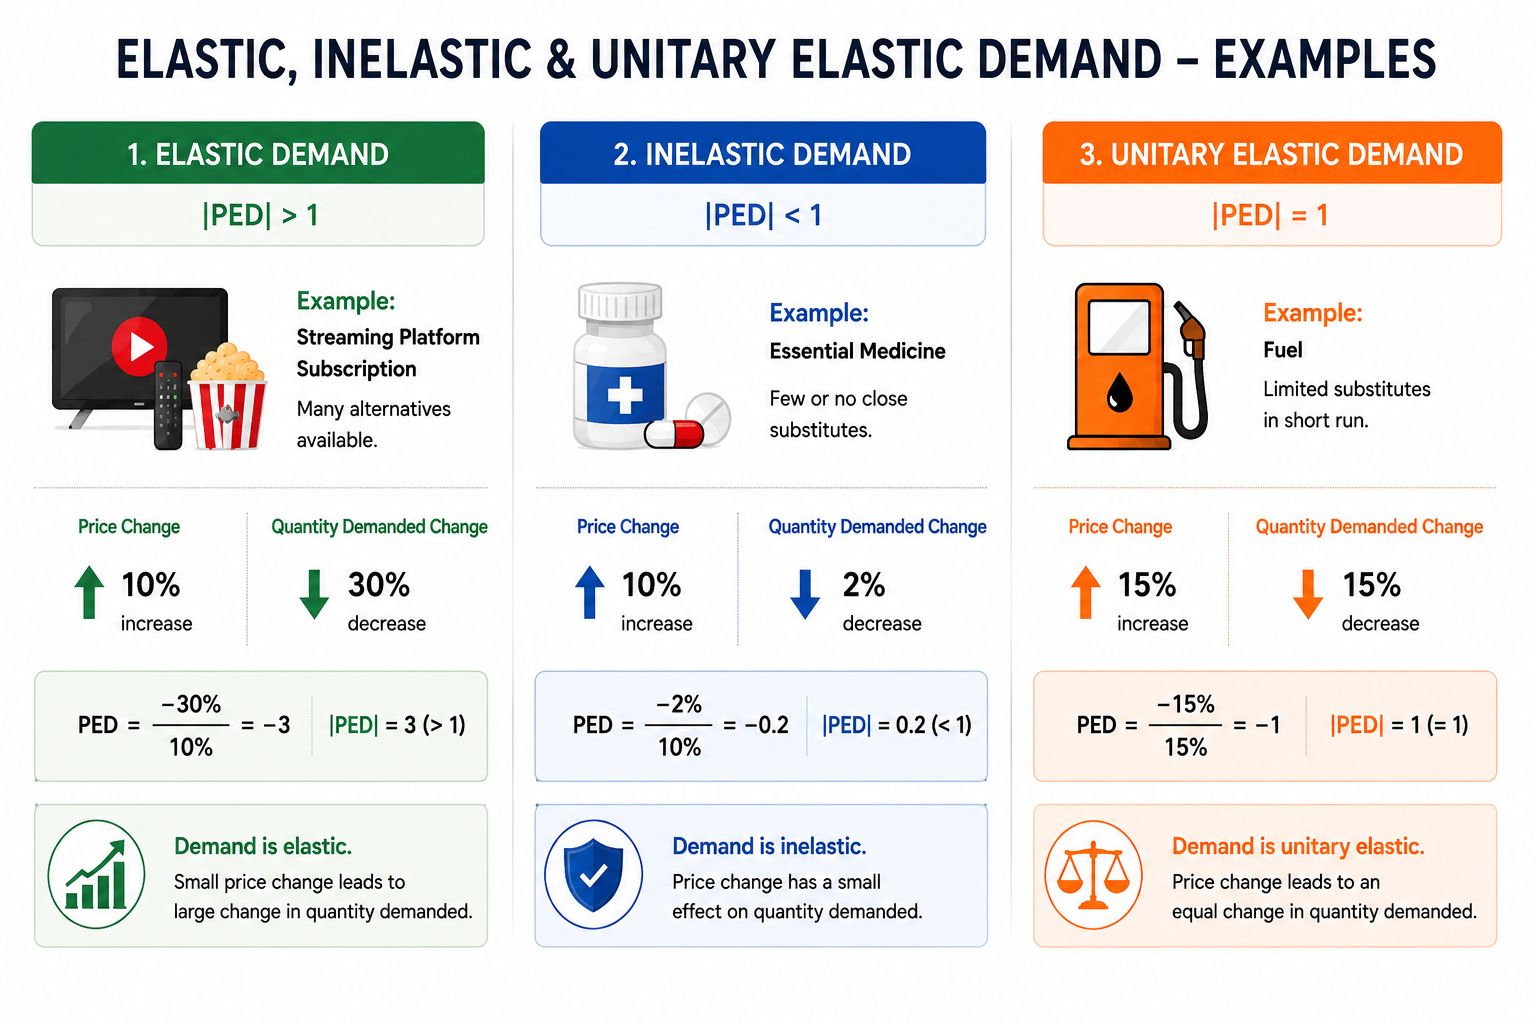
Imagine a streaming platform increases its monthly subscription price from ₹500 to ₹550.
The price increases by 10%.
Many customers have other streaming platforms available. Some may cancel their subscription or switch to a competitor.
Suppose subscriptions fall by 25%.
Then:
PED = -25% / 10% = -2.5
|PED| = 2.5
Since 2.5 is greater than 1, demand is elastic. The quantity demanded changed more than the price. This is possible because consumers have several alternatives.
Now consider an essential medicine. Suppose its price increases by 10%. Patients may still need almost the same quantity.
If quantity demanded falls by only 2%:
PED = -2% / 10% = -0.2
|PED| = 0.2
Since 0.2 is less than 1, demand is inelastic.
The price changed significantly, but quantity demanded changed only slightly. This does not mean consumers are completely unaffected. It simply means their response is smaller compared with the price change.
Suppose a product's price increases by 15%. At the same time, quantity demanded falls by 15%.
Then:
PED = -15% / 15% = -1
|PED| = 1
Therefore, demand is unitary elastic. The percentage change in quantity demanded is exactly equal to the percentage change in price.
When you get an elasticity question, do not immediately try to memorise the examples.
Use the value.
If:
PED > 1 → Elastic demand
PED = 1 → Unitary elastic demand
PED < 1 → Inelastic demand
For example:
Price changes by 20%.
Quantity demanded changes by 40%.
PED = 40% / 20% = 2
Demand is elastic.
If quantity changes by only 5%:
PED = 5% / 20% = 0.25
Demand is inelastic.
The calculation tells you the answer. The real-world factors explain why the result may be high or low.
Also read: What is Hyperinflation? How does it Works? Causes, Effects
Elasticity is closely connected to a business's total revenue. Total revenue is the money a business receives from selling its products.
The formula is:
TR = Price × Quantity Sold
A change in price can affect both the price per unit and the number of units sold. The final effect on revenue depends on the elasticity of demand. This is why businesses need to understand elasticity before changing prices.
When demand is elastic, quantity demanded changes by a larger percentage than price.
In this situation, a price increase usually reduces total revenue.
Why?
Customers respond strongly to the higher price. The fall in quantity sold can be large enough to outweigh the higher price.
If the business wants to increase revenue, lowering the price may work better because the increase in sales can be proportionally larger. The relationship can be summarized as:
Price increases → Total revenue decreases
Price decreases → Total revenue increases
This generally applies when demand is elastic.
The relationship changes when demand is inelastic. Here, quantity demanded changes by a smaller percentage than price. Suppose a business increases its price by 20%, but quantity demanded falls by only 5%.
PED = -5% / 20% = -0.25
Demand is inelastic.
The business may receive more total revenue because the higher price is not followed by a proportionally large fall in sales. The general relationship is:
Price increases → Total revenue increases
Price decreases → Total revenue decreases
This is why businesses selling products with relatively inelastic demand may have more room to raise prices. However, this does not mean prices can be increased without limits. Consumer behavior can change, especially over time.
With unitary elastic demand, the percentage change in quantity demanded equals the percentage change in price.
The elasticity value is:
PED = 1
In this situation, total revenue generally remains unchanged when price changes along the relevant portion of the demand curve.
For example:
Initial price = ₹100
Initial quantity = 100 units
TR = ₹100 × 100 = ₹10,000
Now suppose the price falls to ₹80 and quantity rises to 125 units.
New revenue:
TR = ₹80 × 125 = ₹10,000
Revenue remains the same.
Total Revenue and Elasticity: Quick Summary
| Demand | Price Change | Effect on Total Revenue |
| Elastic | Price increases | Revenue decreases |
| Elastic | Price decreases | Revenue increases |
| Inelastic | Price increases | Revenue increases |
| Inelastic | Price decreases | Revenue decreases |
| Unitary elastic | Price changes | Revenue generally unchanged |
Also read: Modern Revenue Management: New Strategies for 2026
Elasticity is not just an economics concept used in exams. Businesses use it to understand customers and make pricing decisions. Governments can also use it when designing taxes and economic policies.
Here are the main reasons it matters.
A business should know how customers might react before changing its price.
For example, a company selling a product with many competitors may need to keep its price competitive. Elasticity gives the business a better idea of how much pricing flexibility it has.
Businesses can use elasticity to estimate how a price change may affect sales and revenue. Suppose a company is considering a 10% price increase.
Elasticity does not provide a perfect forecast. Other factors can affect sales. Still, it gives businesses a useful starting point for planning.
Governments also consider elasticity when deciding how to tax certain products. Products with inelastic demand may continue to be purchased even after a tax increases their prices. This can make them important sources of tax revenue.
For example, governments may consider consumer responsiveness when designing taxes on products that have relatively stable demand.
However, policymakers must also consider other effects, such as consumer welfare, affordability, and changes in consumption.
Elasticity can help businesses understand their market. It can reveal how sensitive customers are to price and how easily they may switch to competitors.
Businesses can use this information when studying:
For example, if customers quickly move to competitors after a small price increase, the company may need to focus on product quality, service, or differentiation rather than simply raising prices.
Also read: 6 Must-Know Types of Supply Chain Models
Price elasticity is not the only type of elasticity used in economics. Different measures look at different factors that can affect demand or supply.
Cross price elasticity of demand measures how the quantity demanded of one product changes when the price of another product changes.
The formula is:
Cross-Price Elasticity = % Change in Quantity Demanded of Product X / % Change in Price of Product Y
It helps identify whether two products are substitutes or complements.
For example, tea and coffee can be substitutes. If the price of tea increases, some consumers may buy more coffee instead.
Income elasticity of demand measures how demand changes when consumer income changes.
The formula is:
Income Elasticity = % Change in Quantity Demanded / % Change in Income
For example, if a person's income increases and they start eating at restaurants more often, demand for restaurant meals has increased with income.
This measure helps businesses understand how demand may change as consumers' purchasing power changes.
Price elasticity of supply measures how much quantity supplied changes when the price of a product changes.
The formula is:
Price Elasticity of Supply = % Change in Quantity Supplied / % Change in Price
For example, if the price of a product rises and manufacturers can quickly increase production, supply is relatively elastic.
The key difference is simple:
| Type | Measures Response To | Measures Change In |
| Price elasticity of demand | Price | Quantity demanded |
| Cross-price elasticity | Price of another product | Quantity demanded |
| Income elasticity | Income | Quantity demanded |
| Price elasticity of supply | Price | Quantity supplied |
Also read: Inventory Management Made Easy: Complete 2025 Guide
Price elasticity is useful, but it does not provide a perfect picture of consumer behaviour. Several limitations can affect its accuracy.
Calculating elasticity requires reliable price and sales data.
However, sales can change because of many factors at the same time. Advertising, competition, income, seasonality, and consumer preferences can all affect demand.
This makes it difficult to measure the exact effect of a price change.
Consumer behaviour does not remain constant.
A product may have inelastic demand today but become more elastic when new substitutes enter the market.
Brand preferences, technology, trends, and changing lifestyles can also affect how consumers respond to prices.
Therefore, an elasticity estimate should not be treated as a permanent number.
Elasticity can differ between the short run and long run.
In the short run, consumers may have limited alternatives. They may continue buying a product even after a price increase.
Over time, they can find substitutes, change habits, or adopt new products.
For example, after a fuel price increase, consumers may continue driving initially. Over time, some may switch to public transport or other alternatives.
This is why businesses should consider the time period when using elasticity for pricing decisions.
Also read: Master the Supply Chain Management Process Step-by-Step
Price elasticity of demand helps us understand how strongly consumers respond to price changes. Its value can show whether demand is elastic, inelastic, or unitary elastic. Factors such as substitutes, product necessity, income, time, number of uses, and brand loyalty can influence the result.
Central idea is elasticity tells us how much quantity demanded responds when price changes. Once you understand this relationship, the different formulas, graphs, examples, and applications become much easier to understand.
Ready to take the next step in your career? Book a consultation call with upGrad and explore the right learning opportunity for your goals.
Demand becomes easier to predict when consumer behaviour is relatively stable and businesses have reliable historical data. Consistent purchasing patterns, limited competition, and fewer unexpected market changes can improve forecasting. However, demand can still change because of income, preferences, seasonality, technology, and competitor actions.
Consumer income can influence how strongly people respond to price changes. A product that takes up a large share of income may receive greater attention when its price changes. Income elasticity also helps businesses understand how demand may change as consumers become richer or poorer.
Yes. Elasticity can change as consumers get more time to adjust. In the short run, they may continue buying a product because alternatives are limited. Over time, they can switch brands, change habits, find substitutes, or adopt new products, making demand more responsive.
Greater competition usually gives consumers more alternatives. If several businesses offer similar products, customers can switch when one company raises its price. This can make demand for an individual firm's product more elastic. Limited competition may reduce customers' ability to switch easily.
Yes. Demand can become more elastic when new substitutes enter the market, switching becomes easier, or consumers have more time to adjust. Changes in technology can also increase price sensitivity. For example, customers may become more responsive when several competing alternatives become available.
Seasonal changes can influence purchasing behaviour and make elasticity estimates harder to interpret. Demand for some products naturally rises during holidays or particular seasons. A change in sales during such a period may therefore reflect seasonal demand rather than the price change alone.
Strong product differentiation can reduce price sensitivity because customers may view one product as different from its competitors. Brand reputation, quality, design, features, and customer experience can all create differentiation. When alternatives appear less similar, consumers may be less willing to switch.
Yes. The same product can have different elasticity values in different markets. Consumer income, competition, availability of substitutes, preferences, regulations, and purchasing habits can vary between regions. Businesses should therefore avoid assuming that an elasticity estimate from one market applies everywhere.
Expectations about future prices can influence current purchasing decisions. If consumers expect prices to rise, they may purchase earlier. If they expect prices to fall, they may postpone buying. These expectations can temporarily change demand and make price-response patterns more difficult to measure.
Market structure affects the number of choices available to consumers and the pricing power of businesses. In highly competitive markets, customers can often switch easily, making demand for individual products more sensitive to price. In less competitive markets, consumers may have fewer alternatives.
Elasticity can help businesses estimate how sales may respond to a price change. It provides a framework for connecting price movements with changes in quantity demanded. However, it should not be treated as an exact forecast because competition, income, seasonality, preferences, and other factors can also affect sales.
987 articles published
We are an online education platform providing industry-relevant programs for professionals, designed and delivered in collaboration with world-class faculty and businesses. Merging the latest technolo...
Speak with DBA expert
By submitting, I accept the T&C and
Privacy Policy