Best Performance Testing Tools: The Complete Guide and List
By Sriram
Updated on Jul 20, 2026 | 14 min read | 4.49K+ views
Share:

All courses
Certifications
More
By Sriram
Updated on Jul 20, 2026 | 14 min read | 4.49K+ views
Share:
Table of Contents
Quick Overview
In this blog, we will cover what performance testing tools are, the different types of performance testing, and a detailed look at the top open source and commercial tools available right now.
If topics like performance testing tools, catching bottlenecks before they hit production, and building the skills to test applications like a professional interest you, upGrad's Data Science courses can help you build the expertise to run a performance testing life cycle.
Popular Data Science Programs
Performance testing tools let you simulate real user load, track response times, and catch bottlenecks before they reach production. Whether you are testing a website, an API, or a large enterprise system, the tool you pick can decide whether your launch goes smoothly or your servers fall over on day one.
Performance testing tools are software programs built to check how an application behaves under different levels of load. They simulate hundreds or thousands of virtual users hitting your system at once, then measure things like response time, throughput, error rate, and resource usage.
Most tools work by generating scripted requests that mimic real user actions, such as logging in, searching, or checking out. The tool then records how the system responds and generates a report showing where things slowed down or broke.
Also Read: Software Testing Life Cycle (STLC): A Complete Guide
Performance testing tools help determine whether your system will hold up when real users show up. Teams rely on these tools for a few clear reasons:
Without performance testing tools, teams are left guessing how their system will behave under pressure. This is exactly why performance testing tools in software testing have become a standard step, not an optional one.
These tools are also used across web page performance testing tools, mobile app testing, and backend API testing. The exact tool changes depending on the target, but the goal is always to know your limits before your users find them for you.
Also Read: Top API Testing Interview Questions to Advance Your Career.
Free Courses
Performance testing is the process of checking how a system performs under a specific workload. It is not about finding bugs in the way functional testing does.
It is about measuring speed, stability, and scalability under real or simulated conditions. Among all performance testing tools in software testing, this stage is usually where teams get the clearest picture of real world readiness.
This applies whether you are running website performance testing tools on a single landing page or testing a full backend system. A performance test usually looks at:
Also Read: Difference between Testing and Debugging
Performance testing is not a single activity. It covers several distinct test types, each answering a different question.
Type |
What It Checks |
| Load testing | How the system performs under expected user load |
| Stress testing | How the system behaves beyond normal capacity, until it breaks |
| Spike testing | How the system reacts to sudden, sharp increases in traffic |
| Endurance testing | How the system holds up over a long period of sustained load |
| Scalability testing | How well the system scales as load increases gradually |
Each type uncovers a different risk. Load testing tells you if you are ready for normal traffic. Stress testing tells you where your breaking point is. Endurance testing tells you if memory leaks or slow degradation will hurt you over time.
Also Read: Artificial Intelligence in Software Testing Transforming Quality Assurance
The terms Performance Testing and Load Testing are often used interchangeably, but load testing is actually one part of performance testing, not the whole picture.
Performance testing is the umbrella term. It includes load testing, stress testing, spike testing, and more. Load testing specifically checks how a system performs under an expected, realistic number of concurrent users.
Think of performance testing as the full health check, and load testing as one specific test within that check. If you only run load tests, you will know how your app handles normal traffic, but you will not know what happens when traffic doubles overnight or when the system runs continuously for a week.
If you're looking to move beyond testing execution and into the data-driven side of software quality, the Master of Science in Data Science from Liverpool John Moores University, offered in collaboration with upGrad, gives you the credentials and skills to get there.
Data Science Courses to upskill
Explore Data Science Courses for Career Progression
IIIT Bangalore
Executive Post Graduate Certificate in Data Science & AIPlacement Assistance
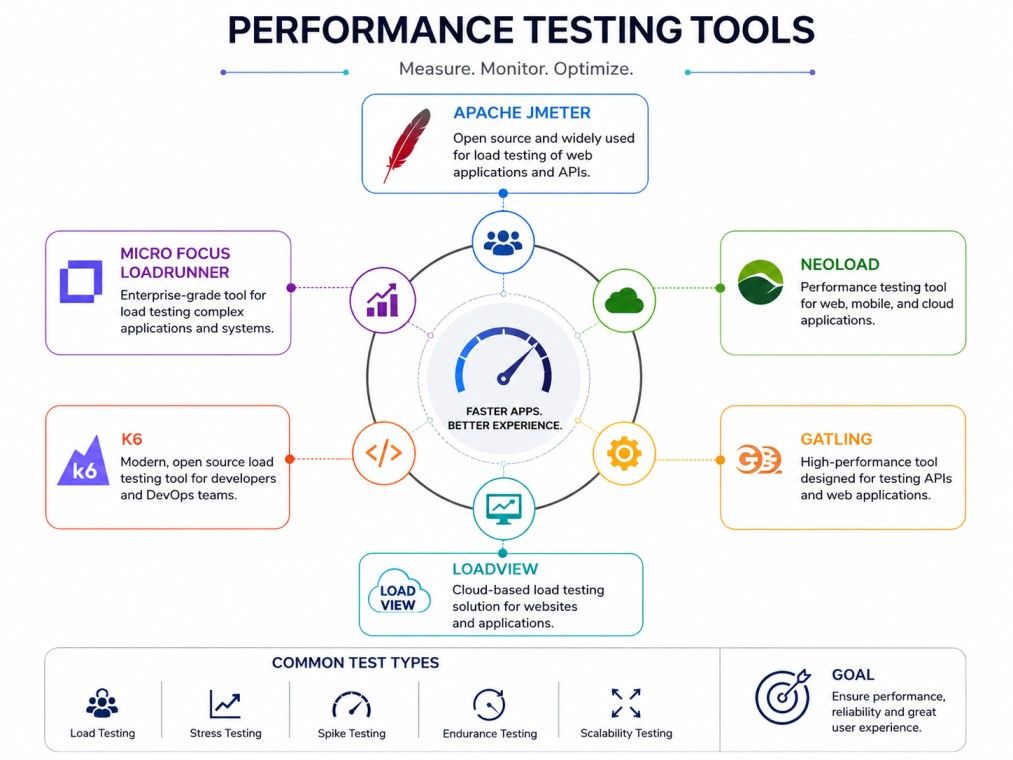
There are multiple tools available in the market. Some are free and open source, built by developer communities. Others are commercial platforms with dedicated support, dashboards, and integrations built for enterprise teams. Below is a practical breakdown of the tools worth knowing.
Open source performance testing tools are a strong starting point for teams that want flexibility without licensing costs. They usually need some technical setup, but they scale well and have active communities behind them.
Benefits: JMeter is one of the oldest and most trusted open source performance testing tools. It supports a wide range of protocols including HTTP, FTP, JDBC, and SOAP, and has a large plugin ecosystem.
Best For: Teams that need a free, protocol-flexible tool with strong community support and no coding requirement for basic tests.
Benefits: k6 is built for developers. Tests are written in JavaScript, which makes it easy to integrate into CI/CD pipelines. It also pairs well with Grafana for real time observability.
Best For: Development teams already using JavaScript who want performance testing built into their deployment pipeline.
Benefits: Gatling is known for handling high concurrency with low resource usage. It uses Scala based scripts and produces clear, readable HTML reports.
Best For: Teams running large scale load tests that need detailed reporting without heavy infrastructure costs.
Benefits: Locust lets you write test scenarios in plain Python, making it approachable for teams already comfortable with the language. It also supports distributed testing across multiple machines.
Best For: Python heavy teams that want a lightweight, code first performance testing tool.
Benefits: Artillery is designed for modern applications, with strong support for HTTP, WebSocket, and Socket.io protocols. Configuration is simple, using YAML files.
Best For: Teams testing real time applications or modern API driven systems that need quick setup.
Commercial tools trade a subscription cost for convenience. They provide dedicated support, polished dashboards, and features built for large scale or enterprise use.
Benefits: BlazeMeter runs JMeter, Gatling, and Locust scripts on cloud infrastructure, so teams do not need to manage their own load generation servers. It also offers strong CI/CD integration.
Best For: Teams that already use open source scripts but want managed, cloud based execution at scale.
Benefits: NeoLoad focuses on enterprise applications, including SAP and Citrix environments, with reusable test assets and detailed root cause analysis.
Best For: Large enterprises running complex, packaged applications that need deep protocol support.
Benefits: LoadRunner is one of the most established names in performance testing software. It supports a huge range of protocols and integrates with most enterprise DevOps toolchains.
Best For: Large organisations with complex, multi protocol systems and a need for enterprise grade support.
Benefits: OctoPerf is built on top of JMeter but adds a cleaner interface, cloud execution, and real time monitoring dashboards.
Best For: Teams that like JMeter's scripting but want an easier, more visual way to run and monitor tests.
Benefits: Azure Load Testing is a fully managed service from Microsoft that integrates directly with Azure DevOps and other Azure services, making it simple to test cloud native applications.
Best For: Teams already building on Azure who want performance testing without leaving their existing cloud ecosystem.
Benefits: WebLOAD combines load testing with AI based analytics to detect bottlenecks automatically and correlate them with the underlying cause.
Best For: Teams that want automated bottleneck detection alongside standard load testing.
Benefits: LoadNinja uses real browsers instead of simulated protocol requests, which gives a more accurate picture of real user experience, especially for JavaScript heavy sites.
Best For: Teams focused on website performance testing tools that need real browser accuracy, not just protocol level simulation.
Tool |
Best For |
Protocols Supported |
Open Source or Paid |
Apache JMeter |
General purpose testing |
HTTP, FTP, JDBC, SOAP |
Open source |
k6 |
Developer led CI/CD testing |
HTTP, WebSocket, gRPC |
Open source |
Gatling |
High concurrency testing |
HTTP, WebSocket, JMS |
Open source |
Locust |
Python based testing |
HTTP, custom protocols |
Open source |
Artillery |
Real time app testing |
HTTP, WebSocket, Socket.io |
Open source |
BlazeMeter |
Managed cloud execution |
HTTP, JDBC, and more |
Paid |
NeoLoad |
Enterprise applications |
SAP, Citrix, HTTP |
Paid |
LoadRunner |
Complex enterprise systems |
Wide protocol range |
Paid |
OctoPerf |
Visual JMeter execution |
HTTP, JDBC |
Paid |
Azure Load Testing |
Azure native apps |
HTTP |
Paid, usage-based |
WebLOAD |
Automated bottleneck detection |
HTTP, and more |
Paid |
LoadNinja |
Real browser testing |
Browser based |
Paid |
Performance issues rarely show up during development. They show up during a big product launch, a marketing push, or a holiday sale, exactly when your system cannot afford to fail. This is why performance testing matters so much.
Metric |
What It Tells You |
| Response time | How fast the system responds to a request |
| Throughput | Number of requests processed per second |
| Error rate | Percentage of failed requests under load |
| CPU and memory usage | How much load the infrastructure is handling |
| Concurrent users | How many users the system can support at once |
Skipping performance testing is a common shortcut, but it usually costs more later. A few hours of testing now can save days of incident response after launch.
Running a performance test is not just about pointing a tool at your application and hitting start. A structured process gives you results you can actually trust and act on.
Following a clear process turns performance testing from a one off task into something your team can repeat confidently before every major release.
Subscribe to upGrad's Newsletter
Join thousands of learners who receive useful tips
Choosing between tools is often easier with a direct, side by side look. Here are three common comparisons teams search for.
Both are developer friendly and built for CI/CD integration.
Both platforms build on top of open source tools, but with different focuses.
With so many options available, picking one comes down to matching the tool to your actual needs, not just picking the most popular name.
There is rarely one single best performance testing tool. The right pick depends on your team's technical skill, budget, and the type of application you are testing.
Different teams need different things from these tools. Here is how the choice usually shifts based on who is using them.
Developers usually prefer tools like k6, Locust, or Gatling, since these let them write test scripts in familiar languages such as JavaScript or Python and plug tests directly into CI/CD pipelines.
Many also use lightweight web page performance testing tools alongside these to check front end load speed before a release.
Teams without heavy coding skills often lean toward tools with visual interfaces, like OctoPerf or LoadNinja, which reduce the need to write complex scripts from scratch.
QA teams typically want a balance of scripting control and reporting clarity. JMeter and BlazeMeter are common choices here, since they combine flexibility with detailed test reports.
Many QA teams also rely on website performance testing tools to check page load speed as part of their regular release checks.
Testing APIs and microservices calls for tools that handle high concurrency and multiple protocols well. k6, Gatling, and JMeter are all strong choices for this kind of web page performance testing tools work.
Mobile performance testing often needs tools that can simulate network conditions and device level constraints.
Some commercial platforms, including BlazeMeter, offer dedicated mobile testing support alongside their standard load testing features.
Running a test is only half the job. Understanding what the results actually mean is where the real value shows up.
Bottlenecks usually show up as a spike in response time, a rise in error rate, or a plateau in throughput even as more virtual users are added. Common causes include:
Start by looking at response time trends across the test duration. A steady increase usually points to a resource leak or a system struggling to keep up. Next, check error rates. A sudden jump in errors at a specific user count often marks your system's real capacity limit.
Cross reference application metrics with infrastructure metrics. If CPU usage spikes at the same time response time degrades, that is a strong signal of where to focus optimisation efforts. Good testing platforms make this correlation easier by showing both sets of data on the same timeline.
Conclusion
Performance testing tools are not an optional practice anymore. They are a core part of building software that can actually handle real users, real traffic spikes, and real growth. Whether you go with a free option like JMeter or k6 or invest in a commercial platform like LoadRunner or BlazeMeter, the goal stays the same: find your system's limits before your users do.
Teams that incorporate performance testing into every stage of development instead of saving it for release day are better equipped to prevent costly performance failures.
Want personalized guidance on Data Science and upskilling? Speak with an expert for a free 1:1 counselling session today.
Performance testing tools are software applications that simulate user load on a system to measure response time, throughput, and stability. They help teams identify weak points before real users encounter them, making them essential for any application expecting meaningful traffic.
A common example is simulating one thousand users logging into an e-commerce app at the same time during a sale. Teams often pair this with website performance testing tools to check page load speed at the same time, since slow pages and backend errors both hurt the user experience.
Performance testing is the broader category that includes load, stress, spike, and endurance testing. Load testing is one specific type within it, focused on checking how a system performs under an expected, normal level of user traffic.
Yes, Apache JMeter is one of the most widely used open source performance testing tools. It supports multiple protocols, including HTTP and JDBC, and is commonly used for load testing web applications, APIs, and databases.
No, Jira is a project and issue tracking tool, not a performance testing tool. Teams sometimes use Jira alongside these tools to log and track bugs or bottlenecks found during testing, but it does not run tests itself.
A QA performance tester is a professional who designs, runs, and analyses performance tests on software systems. Their job involves creating test scenarios, using the right tools, and reporting on how well a system holds up under load.
Load testing software tools are a category of performance testing tools focused specifically on simulating expected user traffic. Examples include Apache JMeter, Gatling, and k6, all of which can generate concurrent virtual users to test system capacity.
There is no single best tool for every team. JMeter suits teams wanting a free, flexible option. k6 suits developer led teams using JavaScript. LoadRunner suits large enterprises needing broad protocol support and dedicated vendor support.
JMeter is free, open source, and community supported, making it accessible for most teams. LoadRunner is a paid enterprise tool with wider protocol coverage and dedicated support, better suited for large organisations running complex, legacy systems.
JMeter is often recommended for beginners because of its large community, extensive documentation, and no strict coding requirement for basic tests. k6 is also beginner friendly for those who already know JavaScript.
Yes, there are several solid open source performance testing tools, including Apache JMeter, k6, Gatling, Locust, and Artillery. These cover most testing needs, from simple web page performance testing tools to complex API load testing, without licensing costs.
727 articles published
Sriram K is a Senior SEO Executive with a B.Tech in Information Technology from Dr. M.G.R. Educational and Research Institute, Chennai. With over a decade of experience in digital marketing, he specia...
Speak with Data Science Expert
By submitting, I accept the T&C and
Privacy Policy
Start Your Career in Data Science Today
Top Resources
Executive Diploma
12 Months
Master's Degree
18 Months
Bootcamp
6 Months