All courses
Agentic AI
Agentic AI

IIIT Bangalore
Executive Programme in Generative AI for LeadersArtificial Intelligence
Degree / Exec. PG

IIIT Bangalore
Executive Diploma in Machine Learning and AI
OPJ Global University
Master’s Degree in Artificial Intelligence and Data Science
Liverpool John Moores University
Master of Science in Machine Learning & AI
Golden Gate University
DBA in Emerging Technologies with Concentration in Generative AIExecutive Certificate

IIITB & IIM, Udaipur
Chief Technology Officer & AI Leadership ProgrammeIIIT Bangalore
Executive Programme in Generative AI for Leaders
upGrad | Microsoft
Gen AI Foundations Certificate Program from MicrosoftupGrad | Microsoft
Gen AI Mastery Certificate for Data AnalysisupGrad | Microsoft
Gen AI Mastery Certificate for Software DevelopmentupGrad | Microsoft
Gen AI Mastery Certificate for Managerial ExcellenceOffline Bootcamps

upGrad
Data Science and AI-MLDoctorate
For All Domains
IIITB & IIM, Udaipur
Chief Technology Officer & AI Leadership Programme
Swiss School of Business and Management
Global Doctor of Business Administration from SSBM
Edgewood University
Doctorate in Business Administration by Edgewood UniversityGolden Gate University
Doctor of Business Administration From Golden Gate University
Rushford Business School
Doctor of Business Administration from Rushford Business School, SwitzerlandGolden Gate University
Master + Doctor of Business Administration (MBA+DBA)-d9bdeff6165f4eb1ba2adcebde78e961.svg)
University of Waterloo
Chief Technology and AI Officer ProgramLeadership / AI
Golden Gate University
DBA in Emerging Technologies with Concentration in Generative AIMachine Learning
Machine Learning
Data Science
Degree / Exec. PG
O.P Jindal Global University
Master’s Degree in Artificial Intelligence and Data ScienceIIIT Bangalore
Executive Diploma in Data Science & AILiverpool John Moores University
Master of Science in Data ScienceExecutive Certificate
upGrad | Microsoft
Gen AI Foundations Certificate Program from MicrosoftupGrad | Microsoft
Gen AI Mastery Certificate for Data AnalysisupGrad | Microsoft
Gen AI Mastery Certificate for Software DevelopmentupGrad | Microsoft
Gen AI Mastery Certificate for Managerial ExcellenceupGrad | Microsoft
Gen AI Mastery Certificate for Content CreationOffline Bootcamps
upGrad
Data Science and AI-MLupGrad
Data AnalyticsMBA
Masters

Paris School of Business
Master of Science in Business Management and TechnologyO.P.Jindal Global University
MBA (with Career Acceleration Program by upGrad)Edgewood University
MBA from Edgewood UniversityO.P.Jindal Global University
MBA from O.P.Jindal Global UniversityGolden Gate University
Master + Doctor of Business Administration (MBA+DBA)Executive Certificate

IMT, Ghaziabad
Advanced General Management ProgramMarketing
Executive Certificate
Offline Bootcamps
upGrad
Digital MarketingManagement
Degree
O.P Jindal Global University
MSc in International Accounting & Finance (ACCA integrated)Paris School of Business
Master of Science in Business Management and Technology
Golden Gate University
Master of Arts in Industrial-Organizational PsychologyExecutive Certificate

IIM Kozhikode
Human Resource Analytics Course from IIM-KupGrad | Microsoft
Gen AI Foundations Certificate Program from MicrosoftEducation
Education

Northeastern University
Master of Education (M.Ed.) from Northeastern UniversityEdgewood University
Doctor of Education (Ed.D.)Edgewood University
Master of Education (M.Ed.) from Edgewood UniversityCertifications
Project Management
Certification

Knowledgehut
Leadership And Communications In ProjectsKnowledgehut
Microsoft Project 2007/2010-ae8d039bbd2a41318308f8d26b52ac8f.svg)
Knowledgehut
Financial Management For Project ManagersKnowledgehut
Fundamentals of Earned Value Management (EVM)Knowledgehut
Fundamentals of Portfolio ManagementKnowledgehut
Fundamentals of Program Management-35c169da468a4cc481c6a8505a74826d.webp&w=128&q=75)
Knowledgehut
CAPM® CertificationsKnowledgehut
Microsoft® Project 2016Certifications & Trainings
-7f4b4f34e09d42bfa73b58f4a230cffa.webp&w=128&q=75)
Knowledgehut
PMP® CertificationKnowledgehut
PMI-RMP® CertificationKnowledgehut
PMP Renewal Learning PathKnowledgehut
Oracle Primavera P6 V18.8Knowledgehut
Microsoft® Project 2013Knowledgehut
PfMP® Certification CourseKnowledgehut
Project Planning and MonitoringPrince2 Certifications

Knowledgehut
PRINCE2® FoundationKnowledgehut
PRINCE2® PractitionerKnowledgehut
PRINCE2 Agile Foundation and PractitionerKnowledgehut
PRINCE2 Agile® Foundation CertificationKnowledgehut
PRINCE2 Agile® Practitioner CertificationManagement Certifications
Knowledgehut
Project Management Masters Certification ProgramKnowledgehut
Change ManagementKnowledgehut
Project Management TechniquesKnowledgehut
Product Management Certification ProgramKnowledgehut
Project Risk Management- Study abroad
- Offline centres
More
%20(1)-d5498f0f972b4c99be680c2ee3b792d7.svg)


49. Variance in ML
What Is K Means Clustering? Algorithm, ML Examples, and Data Mining Use
Did you know? 36% of Indian enterprises are already budgeting for Generative AI (GenAI), which often leverages traditional machine learning methods like clustering, and another 24% are actively experimenting with it. This growing investment highlights the increasing reliance on AI and ML to drive innovation across industries. |
K means clustering is an unsupervised learning algorithm that groups data points into clusters based on similarity. It works by assigning each data point to one of K clusters, minimizing the variance within each group. This technique is widely used in machine learning and data mining for tasks such as customer segmentation, anomaly detection, and pattern recognition.
In this blog, we'll break down the key concepts of K Means Clustering, walk through the algorithm’s steps, and showcase practical Python implementations. You'll also explore real-world examples and applications to better understand how K Means can be used in various industries.
Want to sharpen your machine learning skills for effective K Means clustering processes? upGrad’s Artificial Intelligence & Machine Learning - AI ML Courses can equip you with tools and strategies to stay ahead. Enroll today!
What is K Means Clustering? Understanding Its Algorithm
K Means Clustering in machine learning is an unsupervised learning algorithm designed to group data into clusters based on similarity. It aims to minimize the variance within each cluster, meaning it tries to keep similar data points grouped together.
Common tools like Python’s Scikit-learn library and visualization packages such as Matplotlib and Seaborn are often used to implement and analyze K Means clustering.
If you want to learn essential AI and ML skills that can help you gain expertise in K means Clustering, the following courses from upGrad can help you succeed.
- Masters in Artificial Intelligence and Machine Learning - IIITB Program
- Generative AI Foundations Certificate Program
- Executive Diploma in Machine Learning and AI with IIIT-B
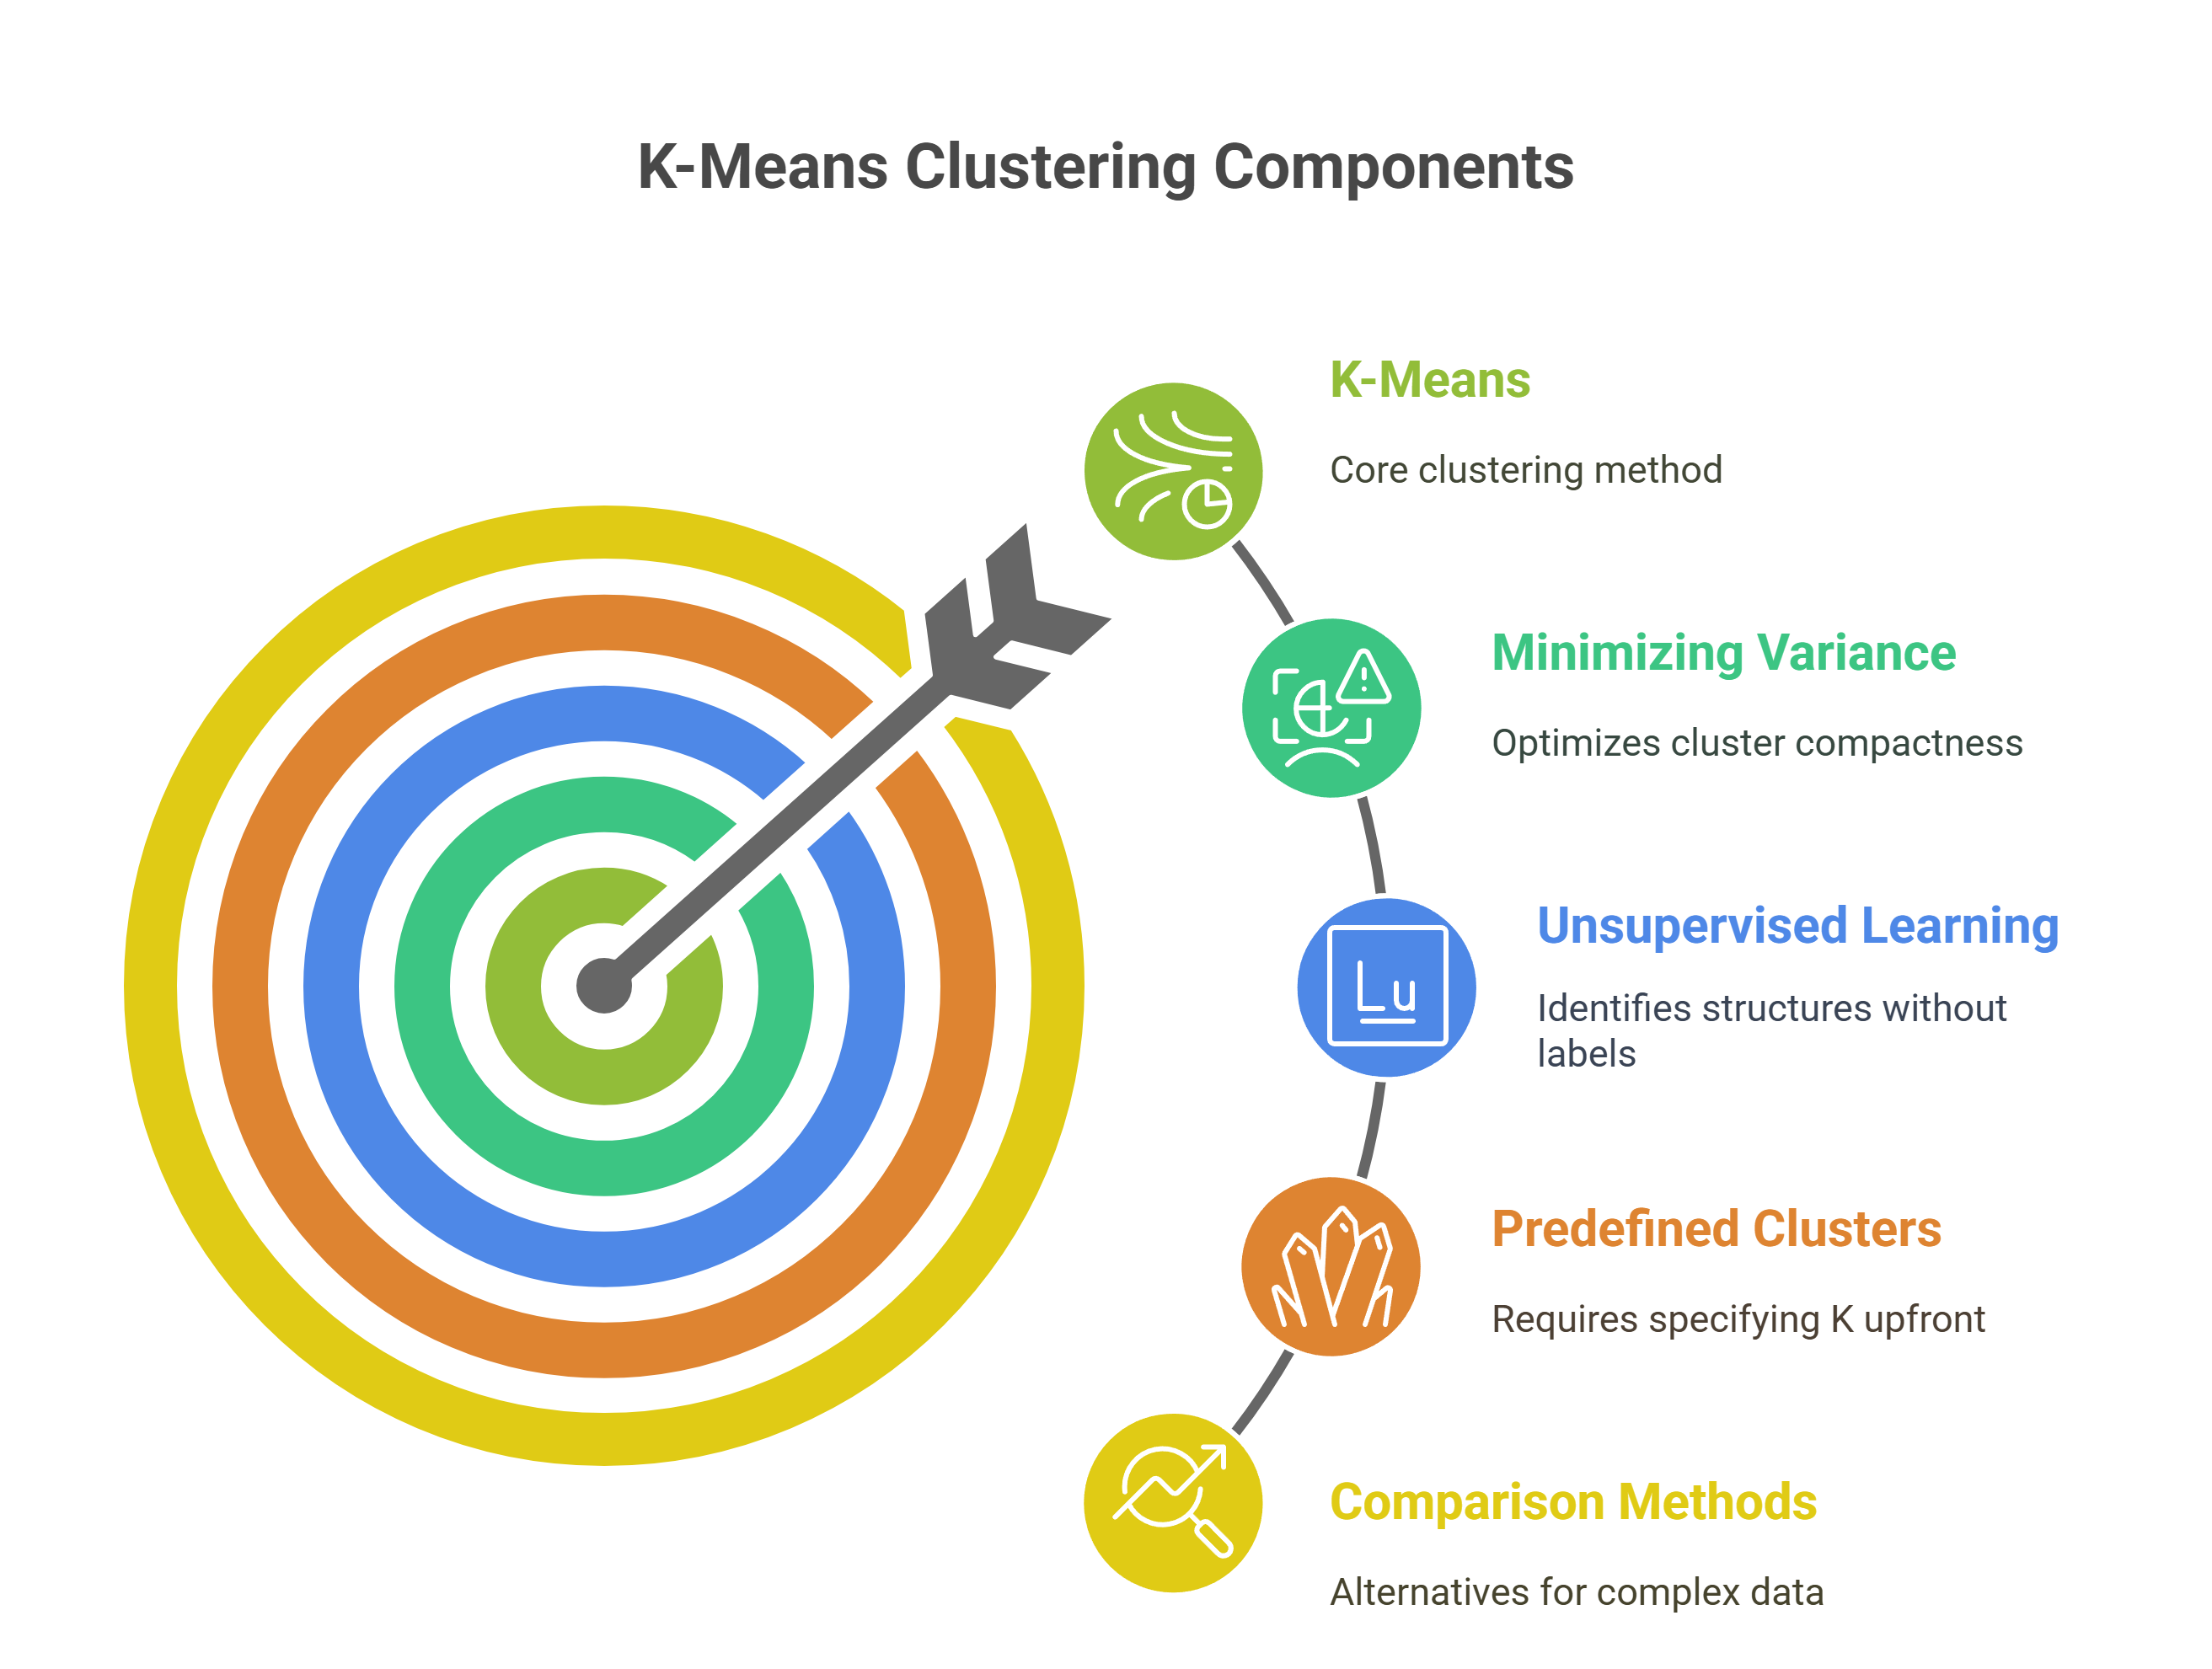
Here’s a breakdown of the key components of K Means and how it compares to other clustering methods:
- Minimizing Intra-Cluster Variance: K-Means optimizes cluster compactness by minimizing the sum of squared Euclidean distances between data points and their respective centroids. This iterative convergence ensures tight cluster grouping, enhancing pattern discernibility in high-dimensional feature spaces.
- Unsupervised Learning Paradigm: As an unsupervised algorithm, K-Means identifies latent structures without labeled data by partitioning the feature space based on similarity metrics. It iteratively recalculates centroids and reassigns points, adapting clusters dynamically to minimize within-cluster variance.
- Predefined Number of Clusters (K): K-Means requires specifying K upfront, influencing cluster granularity and interpretability. Unlike density-based methods like DBSCAN or hierarchical clustering, K-Means assumes spherical clusters and equal variance, which may limit effectiveness on complex data distributions.
Example Scenario:
Imagine you’re analyzing customer behavior data for targeted marketing. Using K-Means, you select the number of customer segments (K) based on your business goals. The algorithm groups customers by purchasing patterns, helping you tailor campaigns precisely without needing prior labels. This method empowers you to uncover actionable insights from raw data effectively.
Now, let's take a closer look at how the algorithm actually works step by step.
K Means Algorithm Explained Step by Step
K Means clustering is an iterative optimization algorithm that partitions a dataset into K non-overlapping groups by minimizing the within-cluster sum of squared Euclidean distances (WCSS). Each iteration refines both the cluster assignments and centroids, aiming for compact, well-separated clusters.
The steps below explain how K Means balances computational efficiency with statistical rigor to achieve convergence.
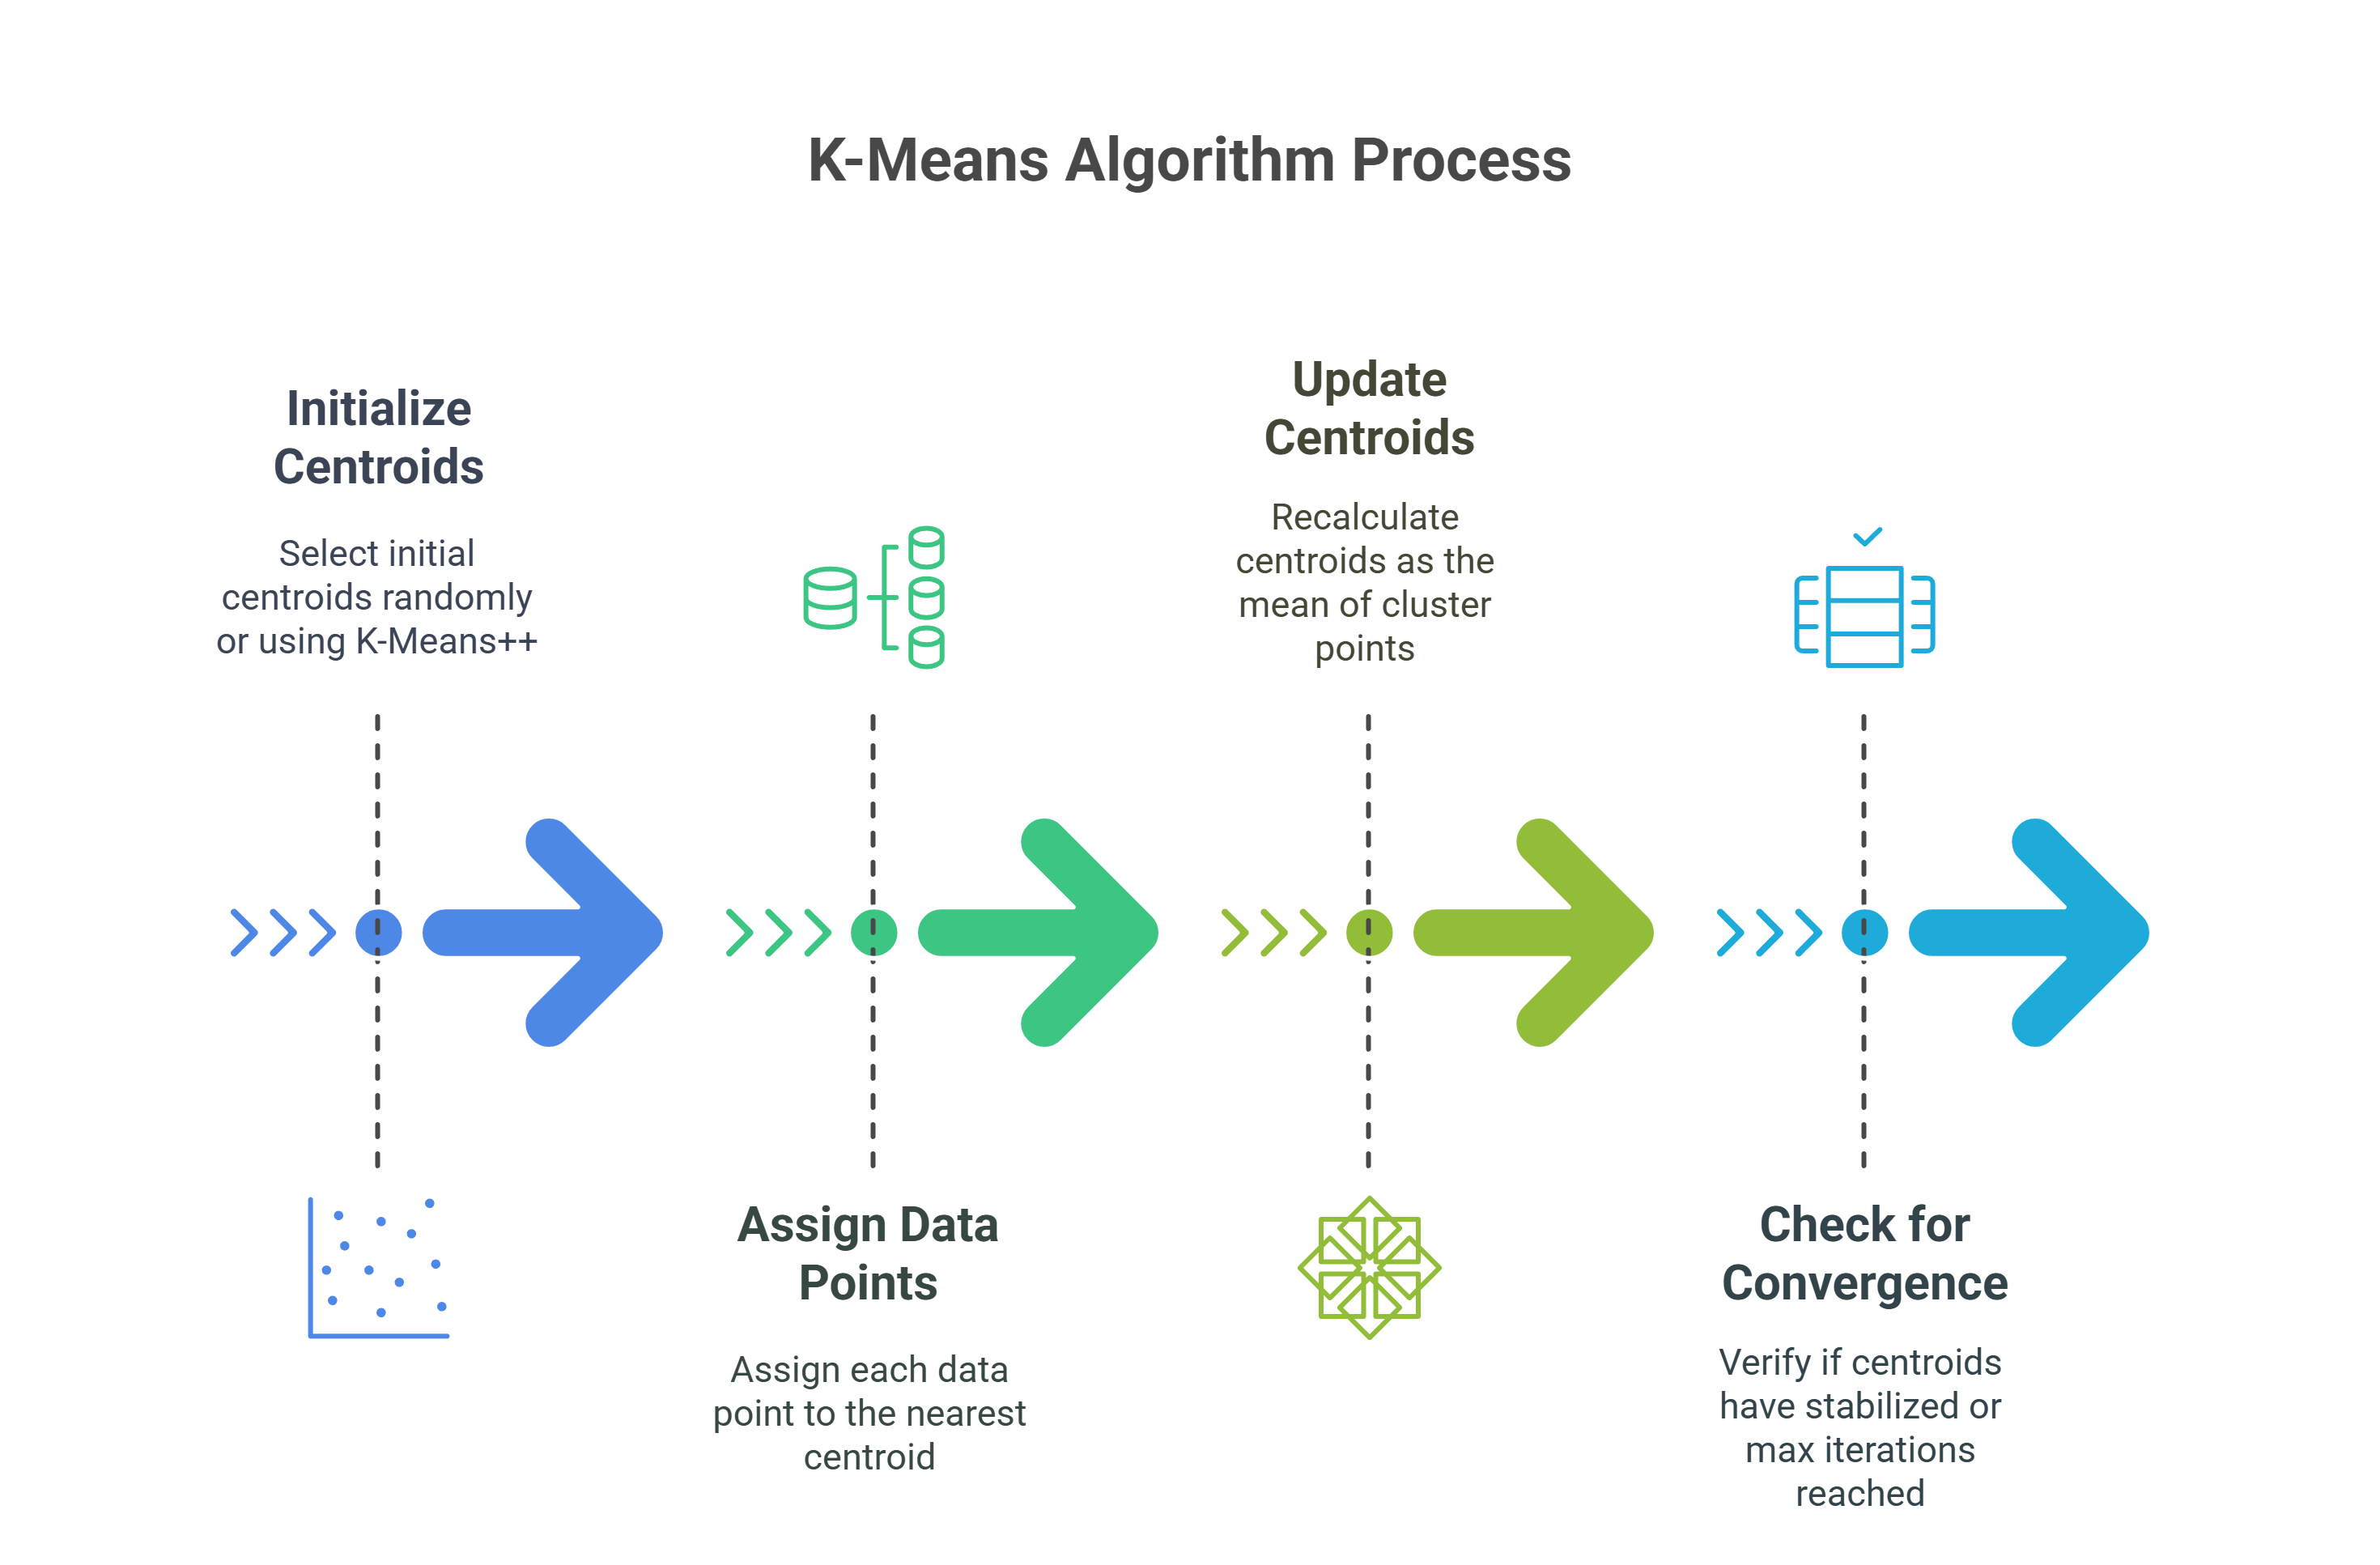
Step 1: Initialize Centroids
- The algorithm selects K initial centroids, typically chosen randomly from your dataset.
- Advanced methods like K-Means++ spread centroids evenly, reducing convergence issues and local minima traps.
- Poor initialization can cause skewed clusters, longer runtimes, and less accurate results.
Example Scenario:
Imagine you’re segmenting customers by age, income, and preferences. The algorithm might pick three random customers as starting centroids for your three segments.
Outcome:
K representative points are established as initial cluster centers, forming the basis for subsequent grouping.
Step 2: Assign Data Points to Nearest Centroid
- Each data point is compared to all centroids using a distance metric, usually Euclidean distance.
- Points are assigned to the cluster with the closest centroid in the multidimensional feature space.
- Proper feature scaling is crucial to avoid bias from dominant variables like income or spending.
Example Scenario:
Suppose a customer earns ₹50,000 and spends ₹5,000 monthly. The algorithm calculates the distance to each centroid and assigns the customer to the nearest cluster.
Outcome:
Data points are grouped into K clusters based on feature similarity, refining cluster definitions.
Step 3: Update Centroids
- After assignments, centroids are recalculated as the mean of all points in their respective clusters.
- This repositioning ensures that centroids accurately represent their clusters, reducing internal variance.
- The update process repeats iteratively until centroids stabilize and clusters no longer change significantly.
Example Scenario:
If your cluster includes customers spending ₹3,000–₹7,000 and new higher-spenders join, the centroid shifts to reflect this, say ₹5,500.
Outcome:
Centroids move to the center of their clusters, improving cluster compactness and preparing for the next iteration.
Step 4: Check for Convergence
- The algorithm verifies if centroid positions have stabilized by measuring movement below a small threshold.
- Clustering stops if the centroid changes fall below this threshold or maximum iterations are reached.
- Otherwise, it loops back to reassign points and update centroids until the convergence criteria are met.
Example Scenario: Imagine the centroids shifted less than 0.001 units between the last two iterations. This indicates minimal change, signaling convergence.
Outcome: The algorithm outputs final clusters where each point is closest to its own centroid, minimizing within-cluster variance (WCSS) for optimal grouping.
If you want to learn clustering algorithms like K-Means and advance in data science, check out upGrad’s Professional Certificate Program in Data Science and AI. The program will help you gain hands-on experience with Matplotlib, Seaborn, Pandas, and more to accelerate your career.
Mathematical Foundation of K Means Algorithm
The K Means algorithm is grounded in mathematical principles that guide how clusters are formed and optimized. Here's a breakdown of the key mathematical components involved:
- Objective Function Using Within-Cluster Sum of SquaresThe K Means algorithm aims to minimize the variance within each cluster. This is measured by the sum of squared distances between data points and their corresponding centroids, called the within-cluster sum of squares (WCSS). The objective is to minimize this sum across all clusters.
Equation:

Where:
- J is the objective function (total sum of squared distances).
- K is the number of clusters.
- Ci represents the set of points in the i-th cluster.
- xj is a data point in cluster Ci.
- μi is the centroid of cluster Ci
This function helps minimize the distance between data points and their respective centroids, ensuring each cluster is as compact as possible.
- Use of Euclidean Distance for Measurement
K-Means uses Euclidean distance to measure how far each data point is from the cluster centroids. The distance between two points x = (x1, x2, x3,....,xn) and y = (y1, y2, y3,....yn) in an n-dimensional space is calculated using the formula.
Equation:

This helps assign each data point to the nearest centroid, forming the clusters.
- Optimization and Convergence Explanation
K Means iteratively minimizes WCSS by reassigning points and updating centroids until the solution converges. One common K-means clustering problem is poor convergence when initial centroids are badly chosen, often leading to suboptimal clustering.
Key Steps:
- Assign data points to the closest centroid based on Euclidean distance.
- Recalculate centroids by finding the mean of the assigned points.
- Repeat until the centroids stabilize or a maximum number of iterations is reached.
This mathematical foundation ensures that K Means clusters data efficiently, making it a powerful tool for unsupervised learning.
If you're looking to master more than flexible clustering techniques, upGrad's Fundamentals of Deep Learning and Neural Networks course is the perfect fit. In just 28 hours, you'll explore key concepts, helping you adapt AI models to complex data. Plus, earn a signed, verifiable e-certificate from upGrad.
Now that you understand the basics and tools behind K Means clustering, let’s explore how the algorithm actually works step by step.
How Does K Means Clustering Work in Machine Learning?
K Means clustering partitions unlabeled data into K groups by minimizing within-cluster variance, making it integral to machine learning pipelines for pattern discovery and preprocessing. Its effectiveness is enhanced when combined with dimensionality reduction techniques like PCA and t-SNE, enabling clearer interpretation of high-dimensional feature spaces common in AI systems.
However, challenges like sensitivity to fixed cluster counts, and assumptions of convex cluster shapes require careful consideration, especially in complex domains involving CNNs and RNNs.
In this section, we’ll walk through the key steps of K Means, from initializing centroids to assigning points and optimizing the clusters.
K Means Algorithm in Machine Learning Pipelines
K Means clustering is a fundamental unsupervised learning algorithm widely integrated into machine learning pipelines for pattern discovery in unlabeled datasets. It partitions data into K clusters by iteratively minimizing intra-cluster variance, making it crucial for preprocessing, feature engineering, and exploratory data analysis.
When combined with dimensionality reduction techniques like PCA or t-SNE, K Means enhances the interpretability of complex, high-dimensional data structures in scalable AI systems.
- Unsupervised Clustering Role: K Means identifies latent data structures without labels by optimizing centroid placement using Euclidean distance metrics in feature space.
- Segmentation & Anomaly Detection: This is essential for customer segmentation and outlier detection, facilitating targeted decision-making and risk mitigation in large-scale datasets.
- Integration with Dimensionality Reduction: Combining K Means with PCA or t-SNE projects high-dimensional data into lower-dimensional embeddings for more precise visualization and interpretation.
- Iterative Optimization: Employs Lloyd’s algorithm or similar iterative refinement to converge on local minima of within-cluster sum of squares (WCSS).
- Scalability & Computational Efficiency: Optimized implementations handle big data using techniques like mini-batch updates and parallel processing on distributed systems.
- Feature Space Considerations: It is sensitive to feature scaling and dimensional correlations; preprocessing, such as normalization or whitening, is critical for meaningful clusters.
Example Scenario
Suppose you’re analyzing customer purchasing patterns in a large retail dataset. You apply K Means to segment customers into behaviorally distinct groups, using PCA to reduce features from dozens to two dimensions. This lets you visualize clusters clearly on a scatter plot, enabling targeted marketing strategies tailored to each segment’s profile.
Also Read: Types of Machine Learning Algorithms with Use Cases Examples
Now, let’s explore some common challenges and limitations of K-means clustering in modern applications.
K Means Clustering Challenges and Limitations
Despite its simplicity and efficiency, K Means clustering faces significant challenges in high-dimensional, dynamic, and complex data domains common in modern AI workflows. Its reliance on fixed cluster counts and centroid initialization can lead to suboptimal partitions, which are problematic in neural networks like CNNs and RNNs. Furthermore, K Means assumes convex cluster geometry, limiting its effectiveness for structures in domains like NLP, where irregular patterns and temporal dynamics prevail.
%20K%20Means%20Clustering%20Problem%20and%20Limitations%20-%20visual%20selection-86234bdca55c481d97edfcb4f303cc12.png)
- Sensitivity to Initial Centroids: Poor centroid initialization can cause convergence to local minima, degrading cluster quality in noisy, high-dimensional datasets. Initialization strategies like K-Means++ mitigate this but don’t eliminate it entirely.
- Predefined Number of Clusters (K): Static K selection is impractical for evolving datasets typical in streaming analytics or user behavior modeling. Adaptive clustering or Bayesian interface methods may better handle variable cluster counts.
- Geometric Assumptions and Cluster Shape: K Means presumes isotropic clusters, which fails with anisotropic, nested, or non-convex data distributions common in CNN feature spaces or irregular NLP embeddings.
- Computational Complexity: Distance recalculations scale poorly with dataset size and dimensionality, causing latency in real-time IoT sensor networks or large-scale video analytics.
Example Scenario:
Imagine deploying K Means for fraud detection in financial transactions enhanced by RNN-based anomaly detection. Poor centroid initialization biases clusters toward normal behavior, obscuring subtle fraud patterns.
Moreover, evolving transaction profiles challenge static K settings, reducing clustering accuracy over time. Understanding these limitations helps you combine K Means with deep learning techniques to improve robustness and scalability.
Also read: What is Overfitting & Underfitting In Machine Learning? [Everything You Need to Learn]
Let’s understand K-means clustering algorithm in ML with reference to visualization and more.
K Means Clustering Algorithm Example in ML
K Means clustering is widely employed in machine learning pipelines for segmenting unlabeled data into meaningful groups based on feature similarity. Iteratively minimizing intra-cluster variance enables the identification of natural clusters, which is crucial for tasks like customer segmentation. When combined with dimensionality reduction techniques such as PCA or t-SNE, K Means facilitates effective visualization and interpretation of complex, high-dimensional datasets.
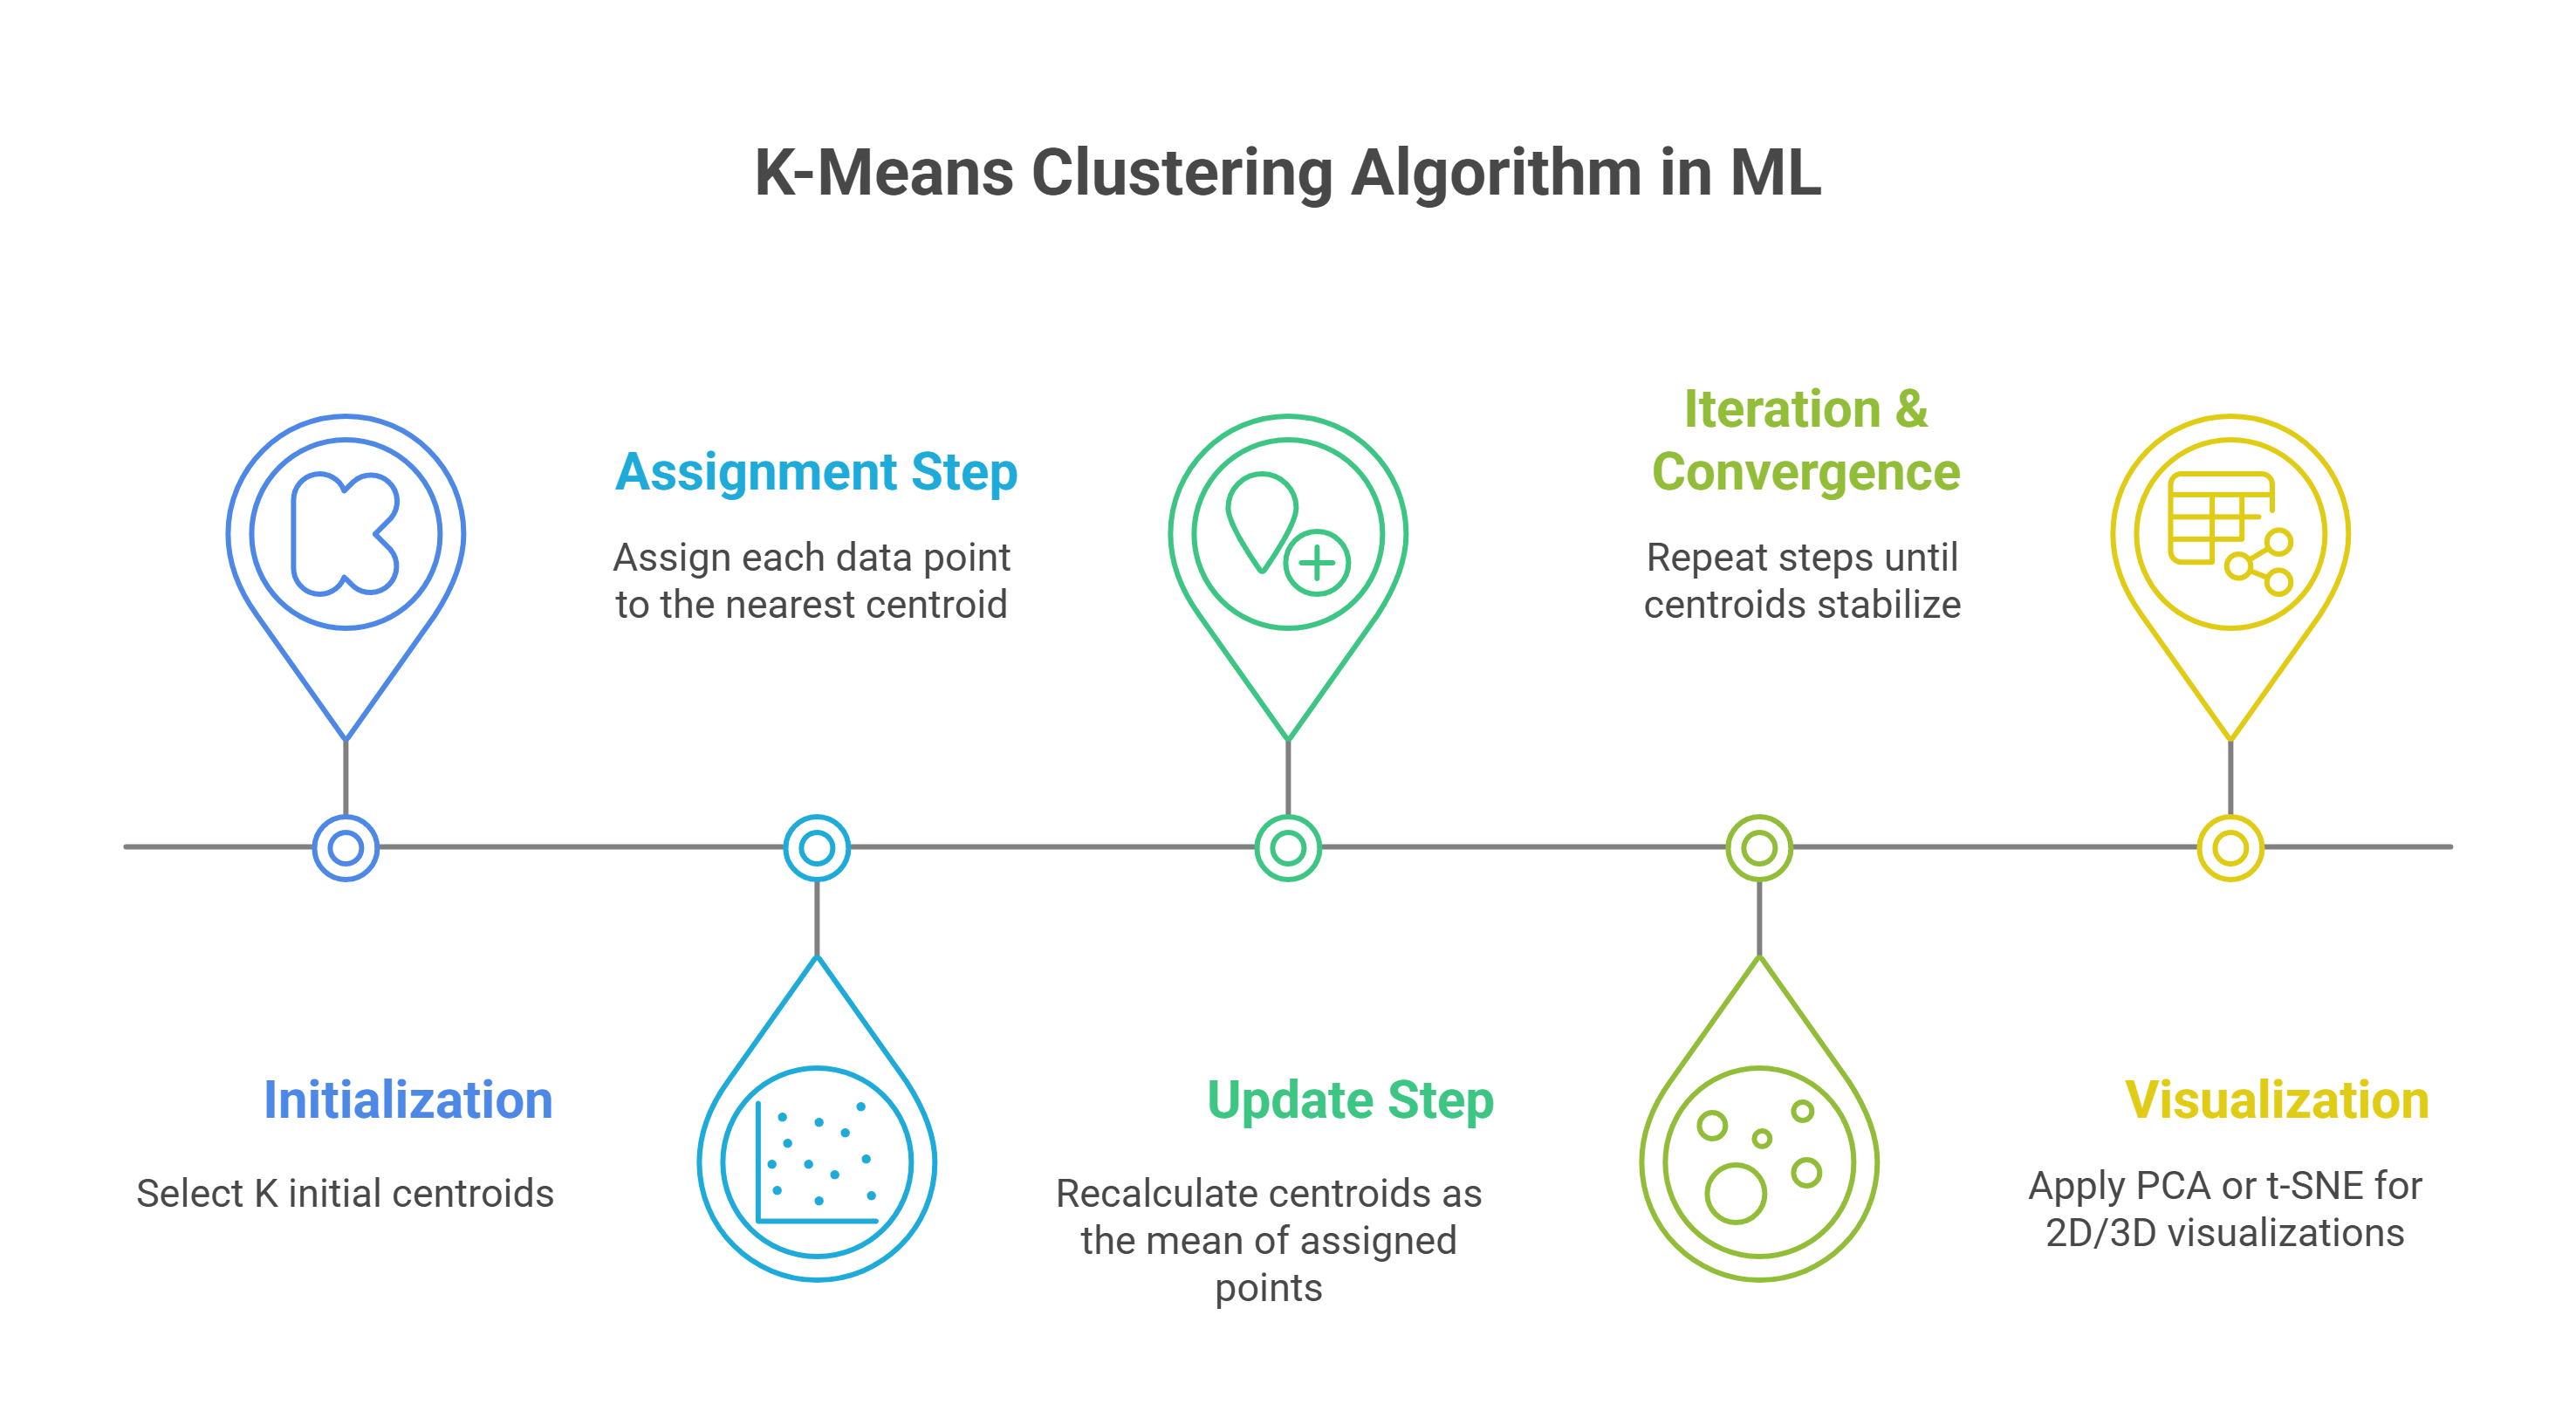
- Initialization: Select K initial centroids, possibly using K-Means++ to optimize starting points and improve convergence speed.
- Assignment Step: Assign each data point to the nearest centroid using a distance metric like Euclidean distance in feature space.
- Update Step: Recalculate centroids as the mean of all points assigned to each cluster, refining cluster centers.
- Iteration & Convergence: Repeat assignment and update steps until centroids stabilize or a maximum iteration limit is reached, ensuring cluster compactness.
- Visualization: Apply PCA or t-SNE to project high-dimensional data into 2D/3D spaces, enabling clear scatter plot visualizations of formed clusters.
Example Scenario:
Imagine you want to segment customers based on purchasing behavior across multiple product categories. You choose K=4 clusters and run K Means on normalized feature data, including purchase frequency, average spend, and product preferences.
After convergence, PCA reduces dimensions to visualize clusters, revealing distinct customer segments. This insight allows you to tailor marketing strategies precisely for each group, improving engagement and sales.
Moving on, let us take a look at how you can implement K means clustering with the help of Python.
Implementation of K Means Algorithm Using Python
Implementing K Means clustering in Python involves using libraries like scikit-learn for efficient algorithm execution and visualization tools such as Matplotlib or Seaborn for interpreting results. Using benchmark datasets like Iris or synthetically generated data allows testing clustering performance on well-understood feature spaces. This practical approach facilitates understanding of core concepts, including centroid initialization, iterative cluster assignment, and convergence evaluation within a reproducible machine learning workflow.
Here's what you need to know:
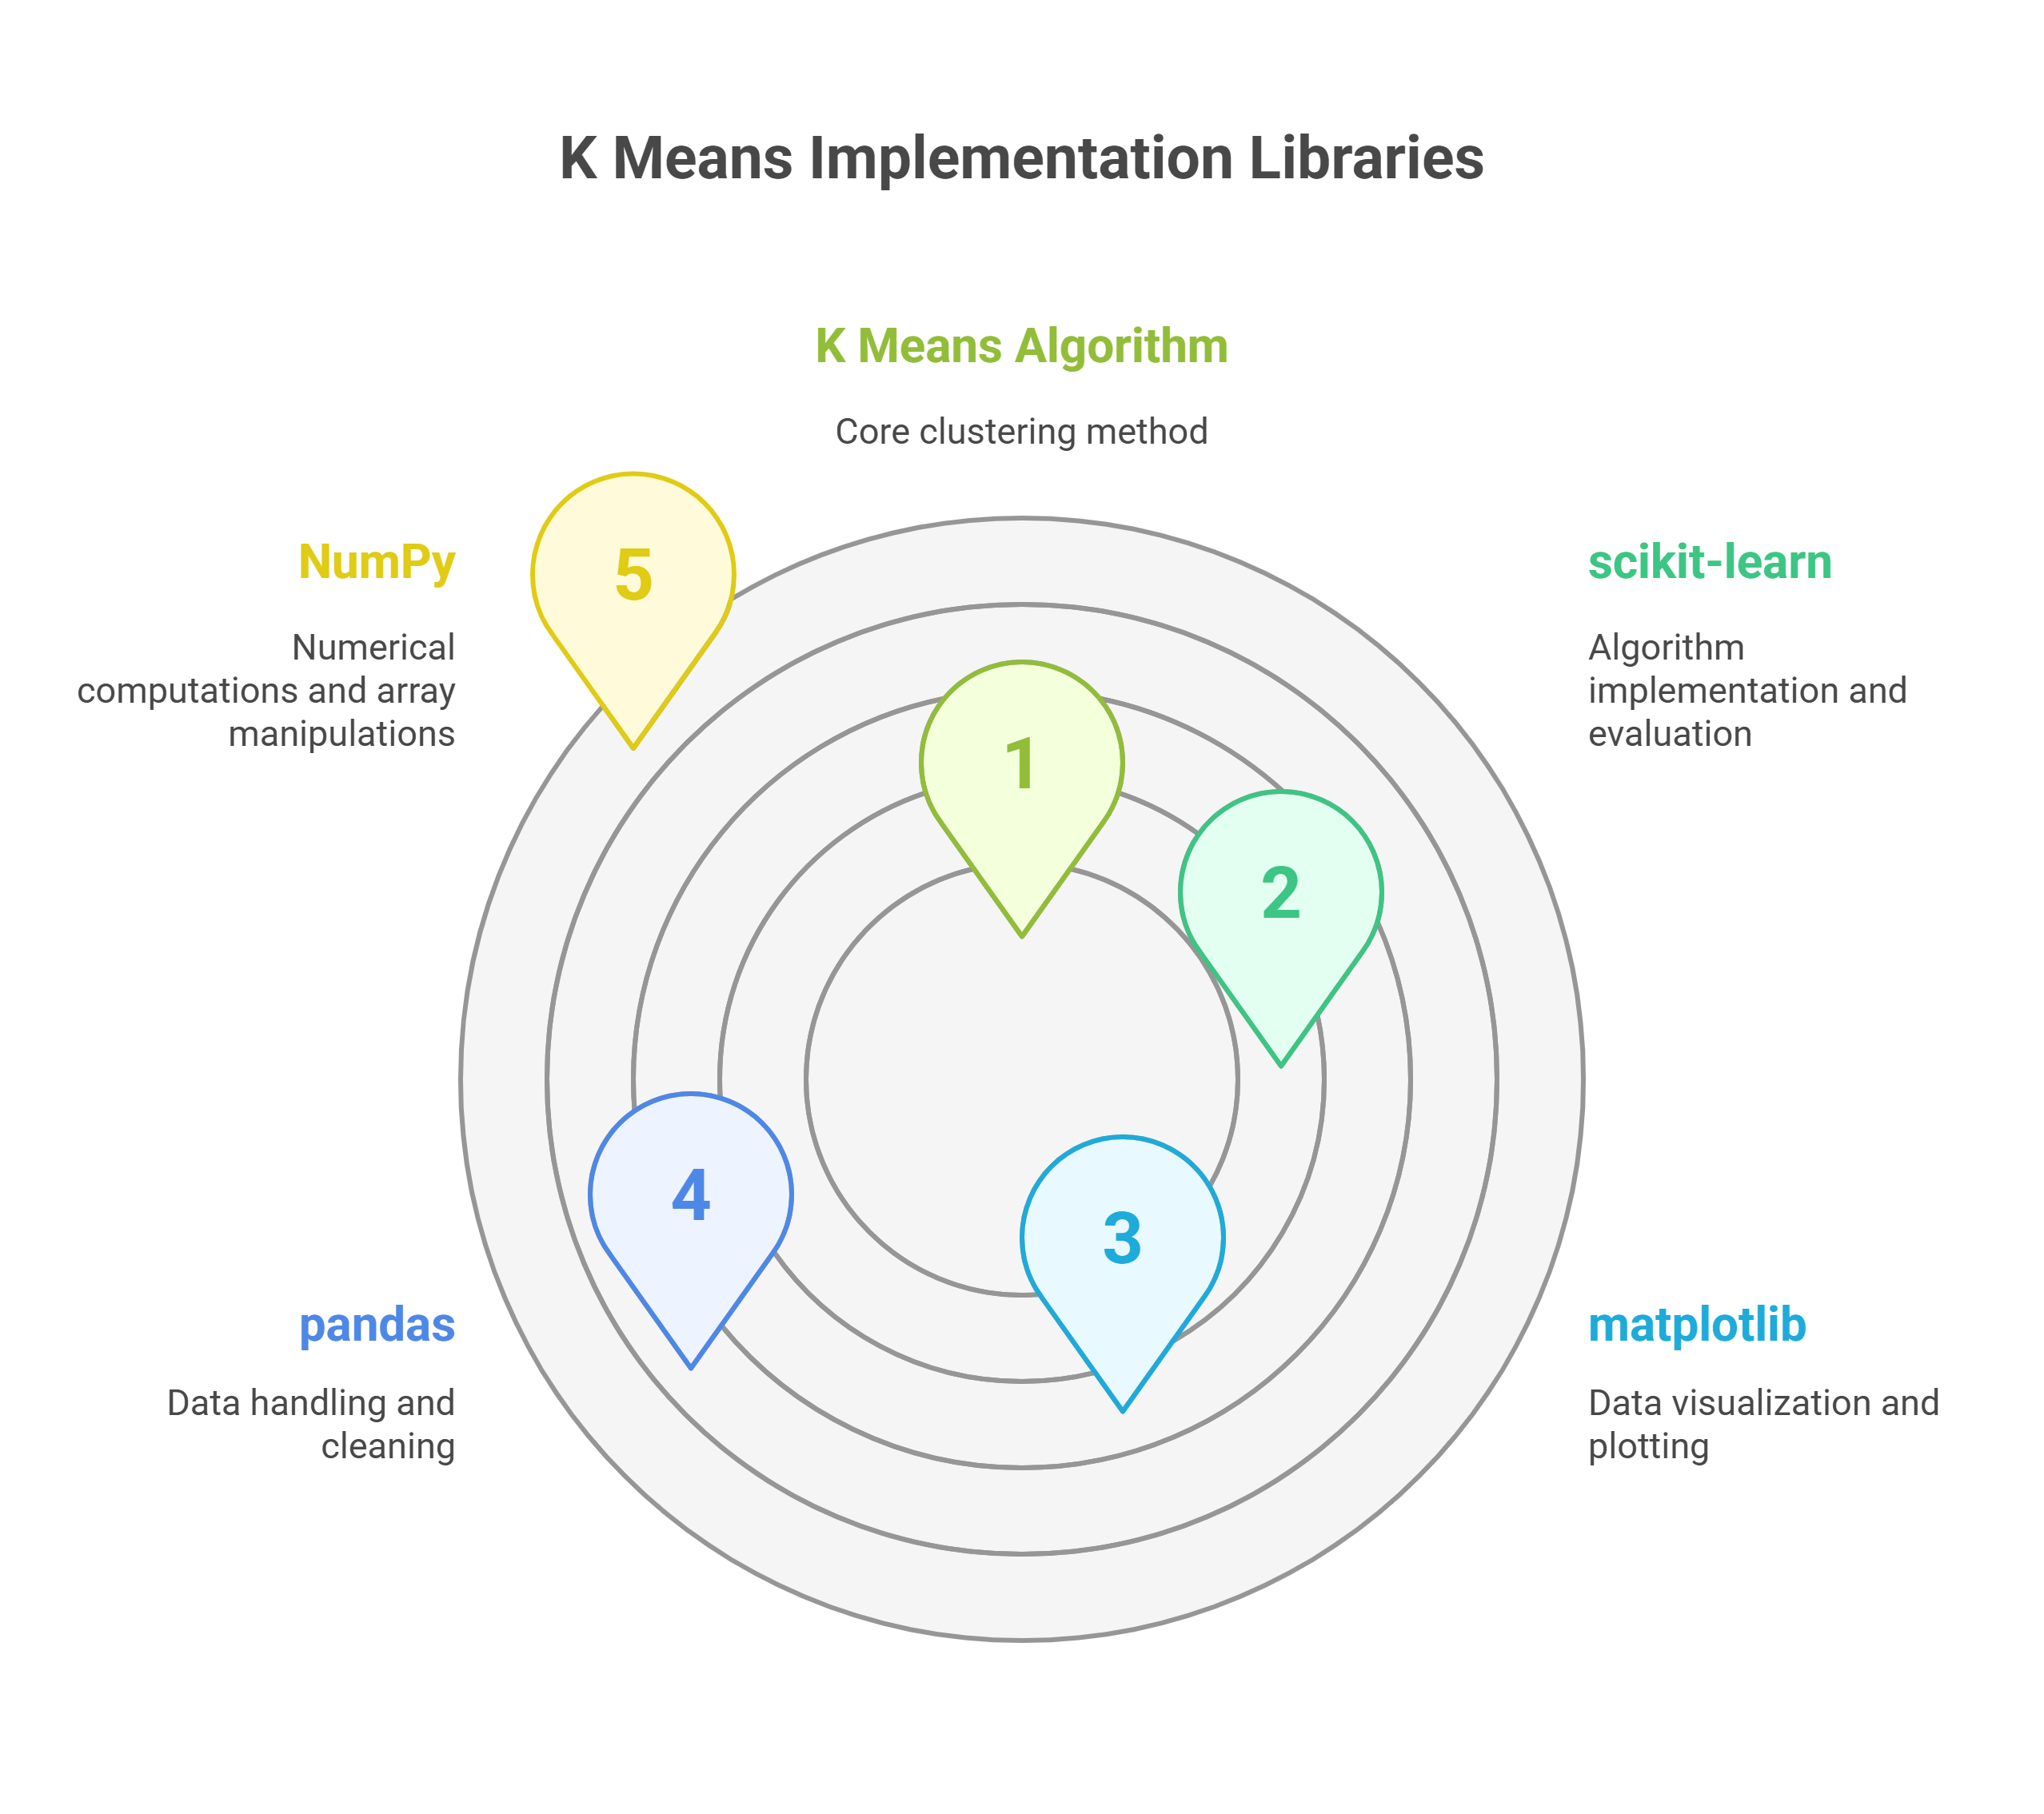
- scikit-learn: This library is a must-have as it provides a simple and efficient implementation of the K Means algorithm. It also includes utilities for clustering, model evaluation, and more.
- matplotlib: For visualizing the results of clustering, you’ll need matplotlib. It allows you to plot data points and centroids, making it easier to understand how well the algorithm grouped your data.
- Pandas: Pandas is great for handling and manipulating data, especially when you’re working with structured datasets. You’ll use pandas to load and clean your data before applying the K Means algorithm.
- NumPy: If your data requires numerical computations or array manipulations, NumPy comes in handy. It allows for efficient handling of large datasets and mathematical operations.
Step-by-Step Python Code K Means Clustering Example
K Means clustering implementation in Python involves loading multivariate data, initializing centroids, iteratively assigning points, and updating clusters based on minimizing within-cluster variance. Visualization with scatter plots and dimensionality reduction helps interpret cluster formation, while the silhouette score and the elbow method assess cluster quality and count. This workflow exemplifies the practical application of unsupervised learning for pattern discovery in practical datasets.
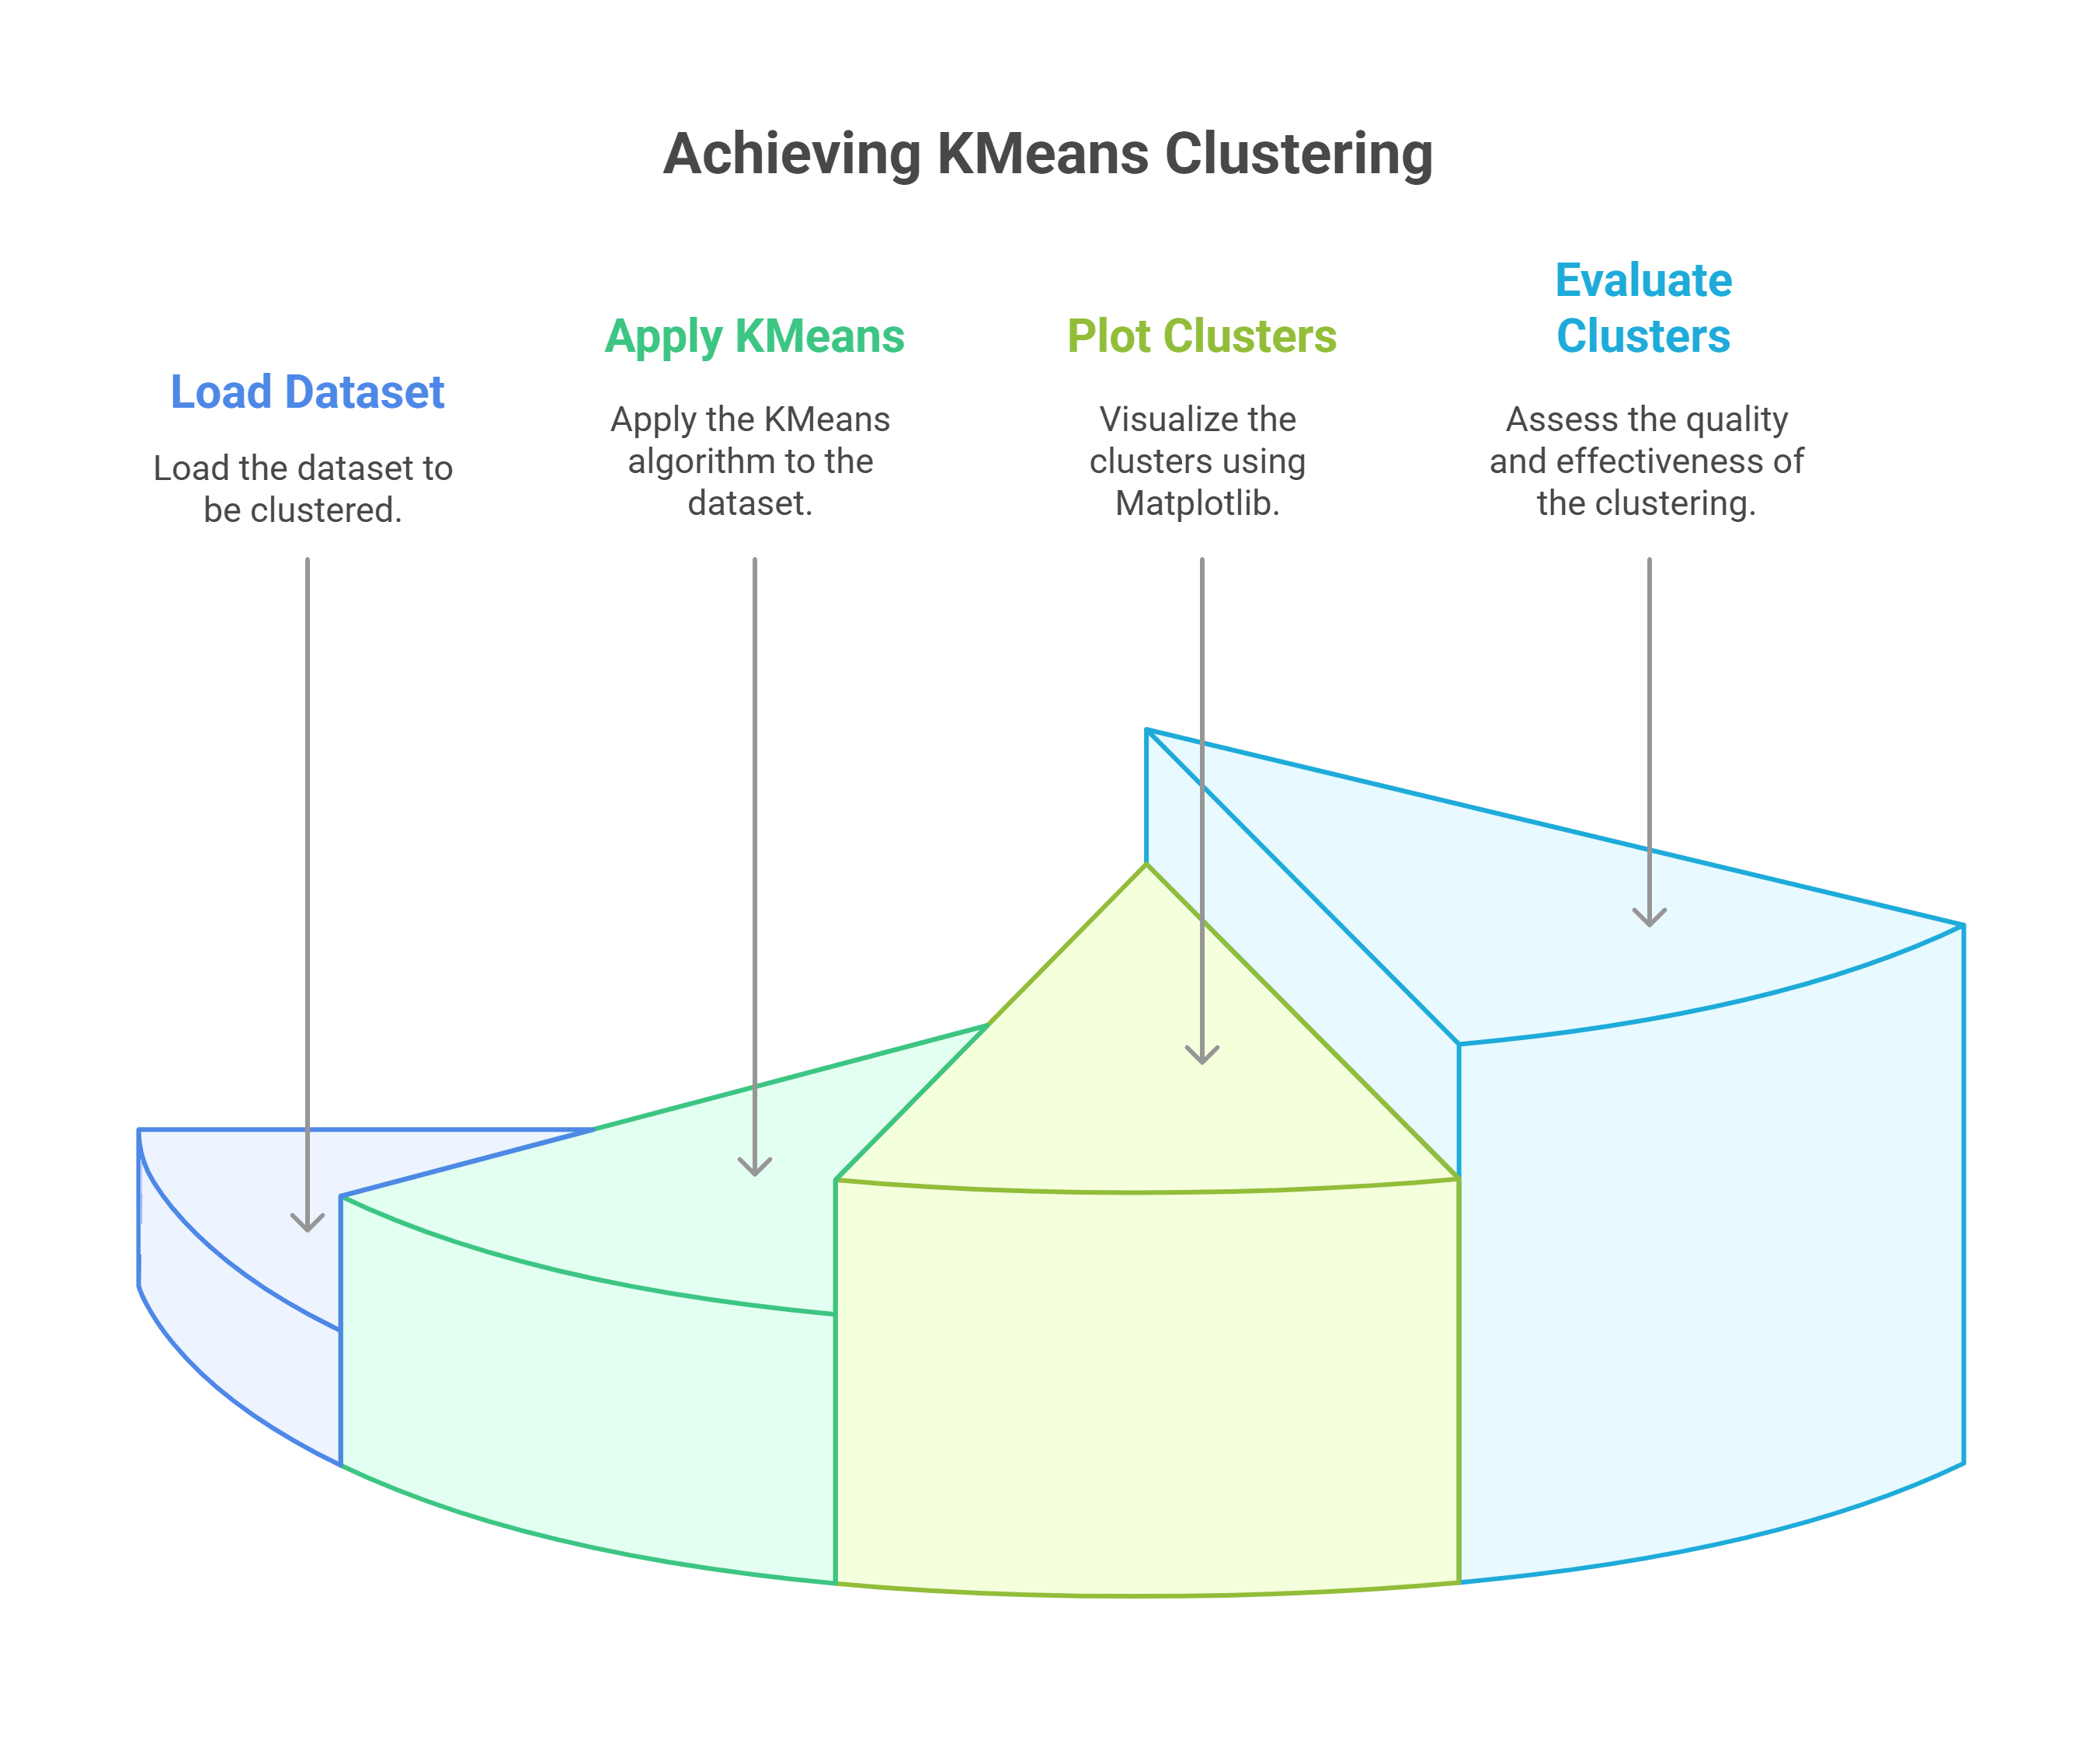
- Load Sample Dataset (e.g., Iris or Synthetic Data) First, we need to load a dataset to apply K Means. The Iris dataset, which is built into scikit-learn, is a good example. It consists of flower data with features like petal length and width, making it ideal for clustering.
from sklearn.datasets import load_iris
import pandas as pd

# Load the Iris dataset
iris = load_iris()
data = pd.DataFrame(iris.data, columns=iris.feature_names)

# Show the first few rows of the dataset
print(data.head())
Output:
sepal length (cm) sepal width (cm) petal length (cm) petal width (cm)
0 5.1 3.5 1.4 0.2
1 4.9 3.0 1.4 0.2
2 4.7 3.2 1.3 0.2
3 4.6 3.1 1.5 0.2
4 5.0 3.6 1.4 0.2
Output Explanation:
The displayed table shows the first five rows of the Iris dataset with features including sepal length, sepal width, petal length, and petal width. Importing the data into a pandas DataFrame allows for efficient manipulation and analysis within Python.
- Apply KMeans() from sklearn.cluster
Next, we apply the KMeans algorithm to the dataset. We’ll start by specifying the number of clusters (K) and then fit the model.
from sklearn.cluster import KMeans

# Initialize KMeans with 3 clusters
kmeans = KMeans(n_clusters=3, random_state=42)

# Fit the model to the data
kmeans.fit(data)

# Get the predicted cluster labels
labels = kmeans.labels_

print(labels)
Output:
[0 0 0 0 0 0 0 0 0 0 1 1 1 1 1 1 1 1 1 1 2 2 2 2 2 2 2 2 2 2 0 0 0 ...]
Output Explanation:
The output array represents the cluster assignments for each data point, with values 0, 1, and 2 indicating membership in one of the three clusters. These labels result from fitting the K-Means model to the Iris dataset, grouping data points based on feature similarity.
- Plot Clusters Using Matplotlib
After applying K Means, it’s helpful to visualize the resulting clusters. We'll plot the clusters using a 2D scatter plot (just using two features for simplicity).
import matplotlib.pyplot as plt

# Plot the clusters based on the first two features
plt.scatter(data.iloc[:, 0], data.iloc[:, 1], c=labels, cmap='viridis')
plt.title('K Means Clustering of Iris Dataset')
plt.xlabel('Sepal Length')
plt.ylabel('Sepal Width')
plt.show()
Output:
plt.scatter(data.iloc[:, 0], data.iloc[:, 1], c=labels, cmap='viridis', edgecolor='k')
plt.title('K Means Clustering of Iris Dataset')
plt.xlabel('Sepal Length (cm)')
plt.ylabel('Sepal Width (cm)')
plt.show()
Output Explanation:
The scatter plot displays data points colored by their assigned clusters, revealing how K Means grouped similar samples based on sepal length and width. This visualization helps you intuitively assess cluster separation and the algorithm’s effectiveness.
Visualizing and Evaluating Clusters
After clustering, it’s important to evaluate the quality of the clusters and visualize them effectively. This helps evaluate cluster separation visually.
- Scatter Plots for 2D Clusters: Scatter plots, like the one we created earlier, are a great way to visualize clusters in 2D. If you have more than two features, you can reduce the data to two dimensions using PCA or t-SNE before plotting. Scores > 0.5 generally indicate well-separated clusters.
- Use of Silhouette Score for Evaluation: The silhouette score measures how similar a data point is to its own cluster compared to other clusters. A higher silhouette score indicates that the points are well-clustered.
from sklearn.metrics import silhouette_score

# Calculate the silhouette score
silhouette = silhouette_score(data, labels)
print(f'Silhouette Score: {silhouette}')
Output:
Silhouette Score: 0.5537
Output Explanation:
The silhouette score is between -1 and 1, where a value closer to 1 indicates well-defined clusters.
- Elbow Method to Determine Optimal K
The elbow method helps determine the optimal number of clusters (K). You plot the sum of squared distances from each point to its assigned centroid (within-cluster sum of squares) for different values of K and look for an "elbow" in the plot.
# Calculate the sum of squared distances for different values of K
wcss = []
for i in range(1, 11):
    kmeans = KMeans(n_clusters=i, random_state=42)
    kmeans.fit(data)
    wcss.append(kmeans.inertia_)

# Plot the elbow graph
plt.plot(range(1, 11), wcss)
plt.title('Elbow Method for Optimal K')
plt.xlabel('Number of Clusters')
plt.ylabel('Within-Cluster Sum of Squares (WCSS)')
plt.show()
Output:
plt.plot(range(1, 11), wcss, marker='o')
plt.title('Elbow Method for Optimal K')
plt.xlabel('Number of Clusters')
plt.ylabel('Within-Cluster Sum of Squares (WCSS)')
plt.show()
Output Explanation:
The elbow plot visualizes how the within-cluster sum of squares (WCSS) decreases as the number of clusters (K) increases. The optimal K is identified at the “elbow” point, where adding more clusters no longer reduces WCSS, indicating a balance between model complexity and fit.
By following this K means clustering example, you can implement K Means clustering in Python, visualize the results, and evaluate the quality of your clusters.
Common Implementation Mistakes to Avoid in K Means
Implementing K Means effectively requires careful attention to data preprocessing, initialization, and validation to ensure meaningful clusters. Overlooking feature scaling or random seed control can lead to inconsistent or biased results. Additionally, blindly trusting clusters without quantitative validation risks misinterpretation, compromising downstream decisions.
Here are some common mistakes to avoid and practical solutions to improve your clustering outcomes:
Mistake | Solution | Explanation |
Skipping Feature Scaling | Always scale or normalize features using StandardScaler or MinMaxScaler. | Ensures no feature dominates the clustering due to its scale. |
Misinterpreting Random State Behavior | Set a fixed random_state when initializing K Means. | Ensures reproducibility and consistency in results. |
Assuming all clusters are meaningful without validation | Use evaluation metrics like silhouette scores, and interpret clusters in context. | Not all clusters will have meaningful insights without proper validation. |
Looking to boost your career in AI and Data Science? The 1-Year Master's Degree in AI & Data Science from O.P. Jindal Global University offers 15+ projects, 500+ hours of learning, and Microsoft Certification. Master tools like Python and Power BI, plus get free access to Microsoft Copilot Pro. Apply now and advance in just 12 months!
Now, we will talk about the applications of K means clustering in data mining.
K Means Clustering in Data Mining Applications
K Means clustering is widely used in data mining due to its simplicity and effectiveness in grouping data into meaningful patterns. From retail to telecom and bioinformatics, this algorithm helps uncover insights from large, unlabeled datasets, making it a crucial tool for many industries. In this section, we will explore how K Means shines in exploratory analysis where no labels exist, revealing hidden data structures.
K Means Clustering in Data Mining Use Cases
K Means clustering is pivotal in extracting actionable insights from unlabeled datasets across industries by segmenting data into homogeneous groups. Its integration with data visualization and analysis tools such as Excel, Power BI, and Tableau enhances interpretability and supports data-driven decision-making. Using K Means in data mining enables businesses and researchers to uncover latent structures, optimize strategies, and accelerate innovation.
- Retail Customer Profiling: K Means segments customers based on purchase behavior, enabling personalized marketing campaigns. Visualizing segments in Power BI or Tableau helps tailor promotions effectively.
- Telecom Churn Prediction: Telecom companies cluster users by usage patterns to identify churn risks and customize retention plans. Data dashboards in Excel integrate clustering outputs for real-time monitoring.
- Bioinformatics Grouping: K Means clusters genes or proteins by expression levels, aiding disease marker identification. Visual analytics tools like Tableau facilitate exploration of complex biological datasets.
- Unlabeled Data Pattern Discovery: K Means automates clustering in large, unlabeled datasets to reveal hidden consumer trends. Coupling with Power BI provides dynamic visualization for market research insights.
Example Scenario:
Imagine you’re analyzing a large customer dataset in Excel with thousands of records and multiple features. Applying K Means clustering segments customers into distinct groups based on buying habits. Using Power BI, you visualize these clusters, enabling you to create targeted marketing strategies for high-value segments. This integration empowers you to make informed, data-driven decisions efficiently.
Now, let’s understand the K-means clustering algorithm in data mining workflows like batch processing and more.
K Means Clustering Algorithm in Data Mining Workflows
Integrating K Means clustering into data mining workflows enhances automation and scalability for analyzing vast, high-dimensional datasets. It synergizes effectively with data warehousing solutions and preprocessing pipelines, preparing normalized inputs for clustering. Moreover, K Means complements machine learning frameworks like TensorFlow and PyTorch within large-scale bioinformatics and industrial data mining pipelines, accelerating pattern discovery and insight generation.
- Data Warehousing and Preprocessing: Normalized and cleansed data stored in warehouses feed K Means clustering for effective segmentation. This integration ensures high data quality, which is essential for accurate clustering in production environments.
- Scalable Batch Processing: K Means scales to massive datasets, processing them in batches within big data frameworks. Compatibility with distributed computing environments enables integration alongside TensorFlow or PyTorch models for hybrid analytics.
- High-Dimensional Data Handling: The algorithm efficiently manages high-dimensional feature spaces typical in genomics or IoT sensor data. Before deep learning pipelines, it is a preprocessing step for feature grouping or dimensionality reduction.
Example Scenario:
Consider you are working with large-scale telecom data stored in a cloud data warehouse. After preprocessing and normalization, you apply K Means clustering to segment customers by behavior. Integrating results with TensorFlow models helps predict churn more accurately by combining cluster insights with temporal patterns.
Also Read: Top 5 Machine Learning Models Explained For Beginners
K Means Algorithm Example in Data Mining
K Means clustering is critical in uncovering latent patterns within complex customer datasets, enabling precise customer profiling in e-commerce. By integrating data from HTML front-ends, C# backend services, and HTTP-based pipelines, businesses capture rich, multidimensional features essential for segmentation. This clustering approach reveals meaningful behavioral patterns, empowering targeted marketing and personalized user experiences that drive retention and revenue growth.
Here’s a stepwise approach for data mining workflow:
- Data Collection: Aggregate customer data from web interfaces (HTML or CSS) and backend systems (C#) via HTTP protocols, capturing key features like purchase frequency and browsing habits.
- Data Preprocessing: Normalize, clean, and encode data to prepare consistent inputs, essential for accurate pattern discovery and cluster formation.
- Applying K Means: Segment customers into distinct groups based on behavioral similarities, enhancing the granularity of customer profiles for actionable insights.
- Model Evaluation: Use silhouette scores and visualization techniques to validate cluster quality, ensuring patterns are reliable.
Example Scenario:
Imagine using K Means to analyze customer data collected through your e-commerce site’s HTML forms and processed by C# APIs. The algorithm uncovers distinct purchasing behavior clusters, enabling you to tailor marketing strategies for each segment. This focused approach enhances customer engagement by delivering relevant offers, ultimately increasing loyalty and sales.
Now, let’s explore some of the tips that can be useful for using K Means Clustering in machine learning scenarios.
Tips for Effective Use of K Means Clustering in Machine Learning
Effective use of K Means clustering requires parameter tuning, particularly selecting an appropriate cluster count (K), using techniques like the elbow method and silhouette analysis. Understanding the algorithm’s assumptions, such as spherical cluster shapes and uniform densities, is crucial to avoid misleading outcomes in complex or noisy datasets.
Using advanced initialization methods like K Means++ and considering alternative algorithms such as DBSCAN ensures robust, scalable clustering performance in diverse machine learning workflows.
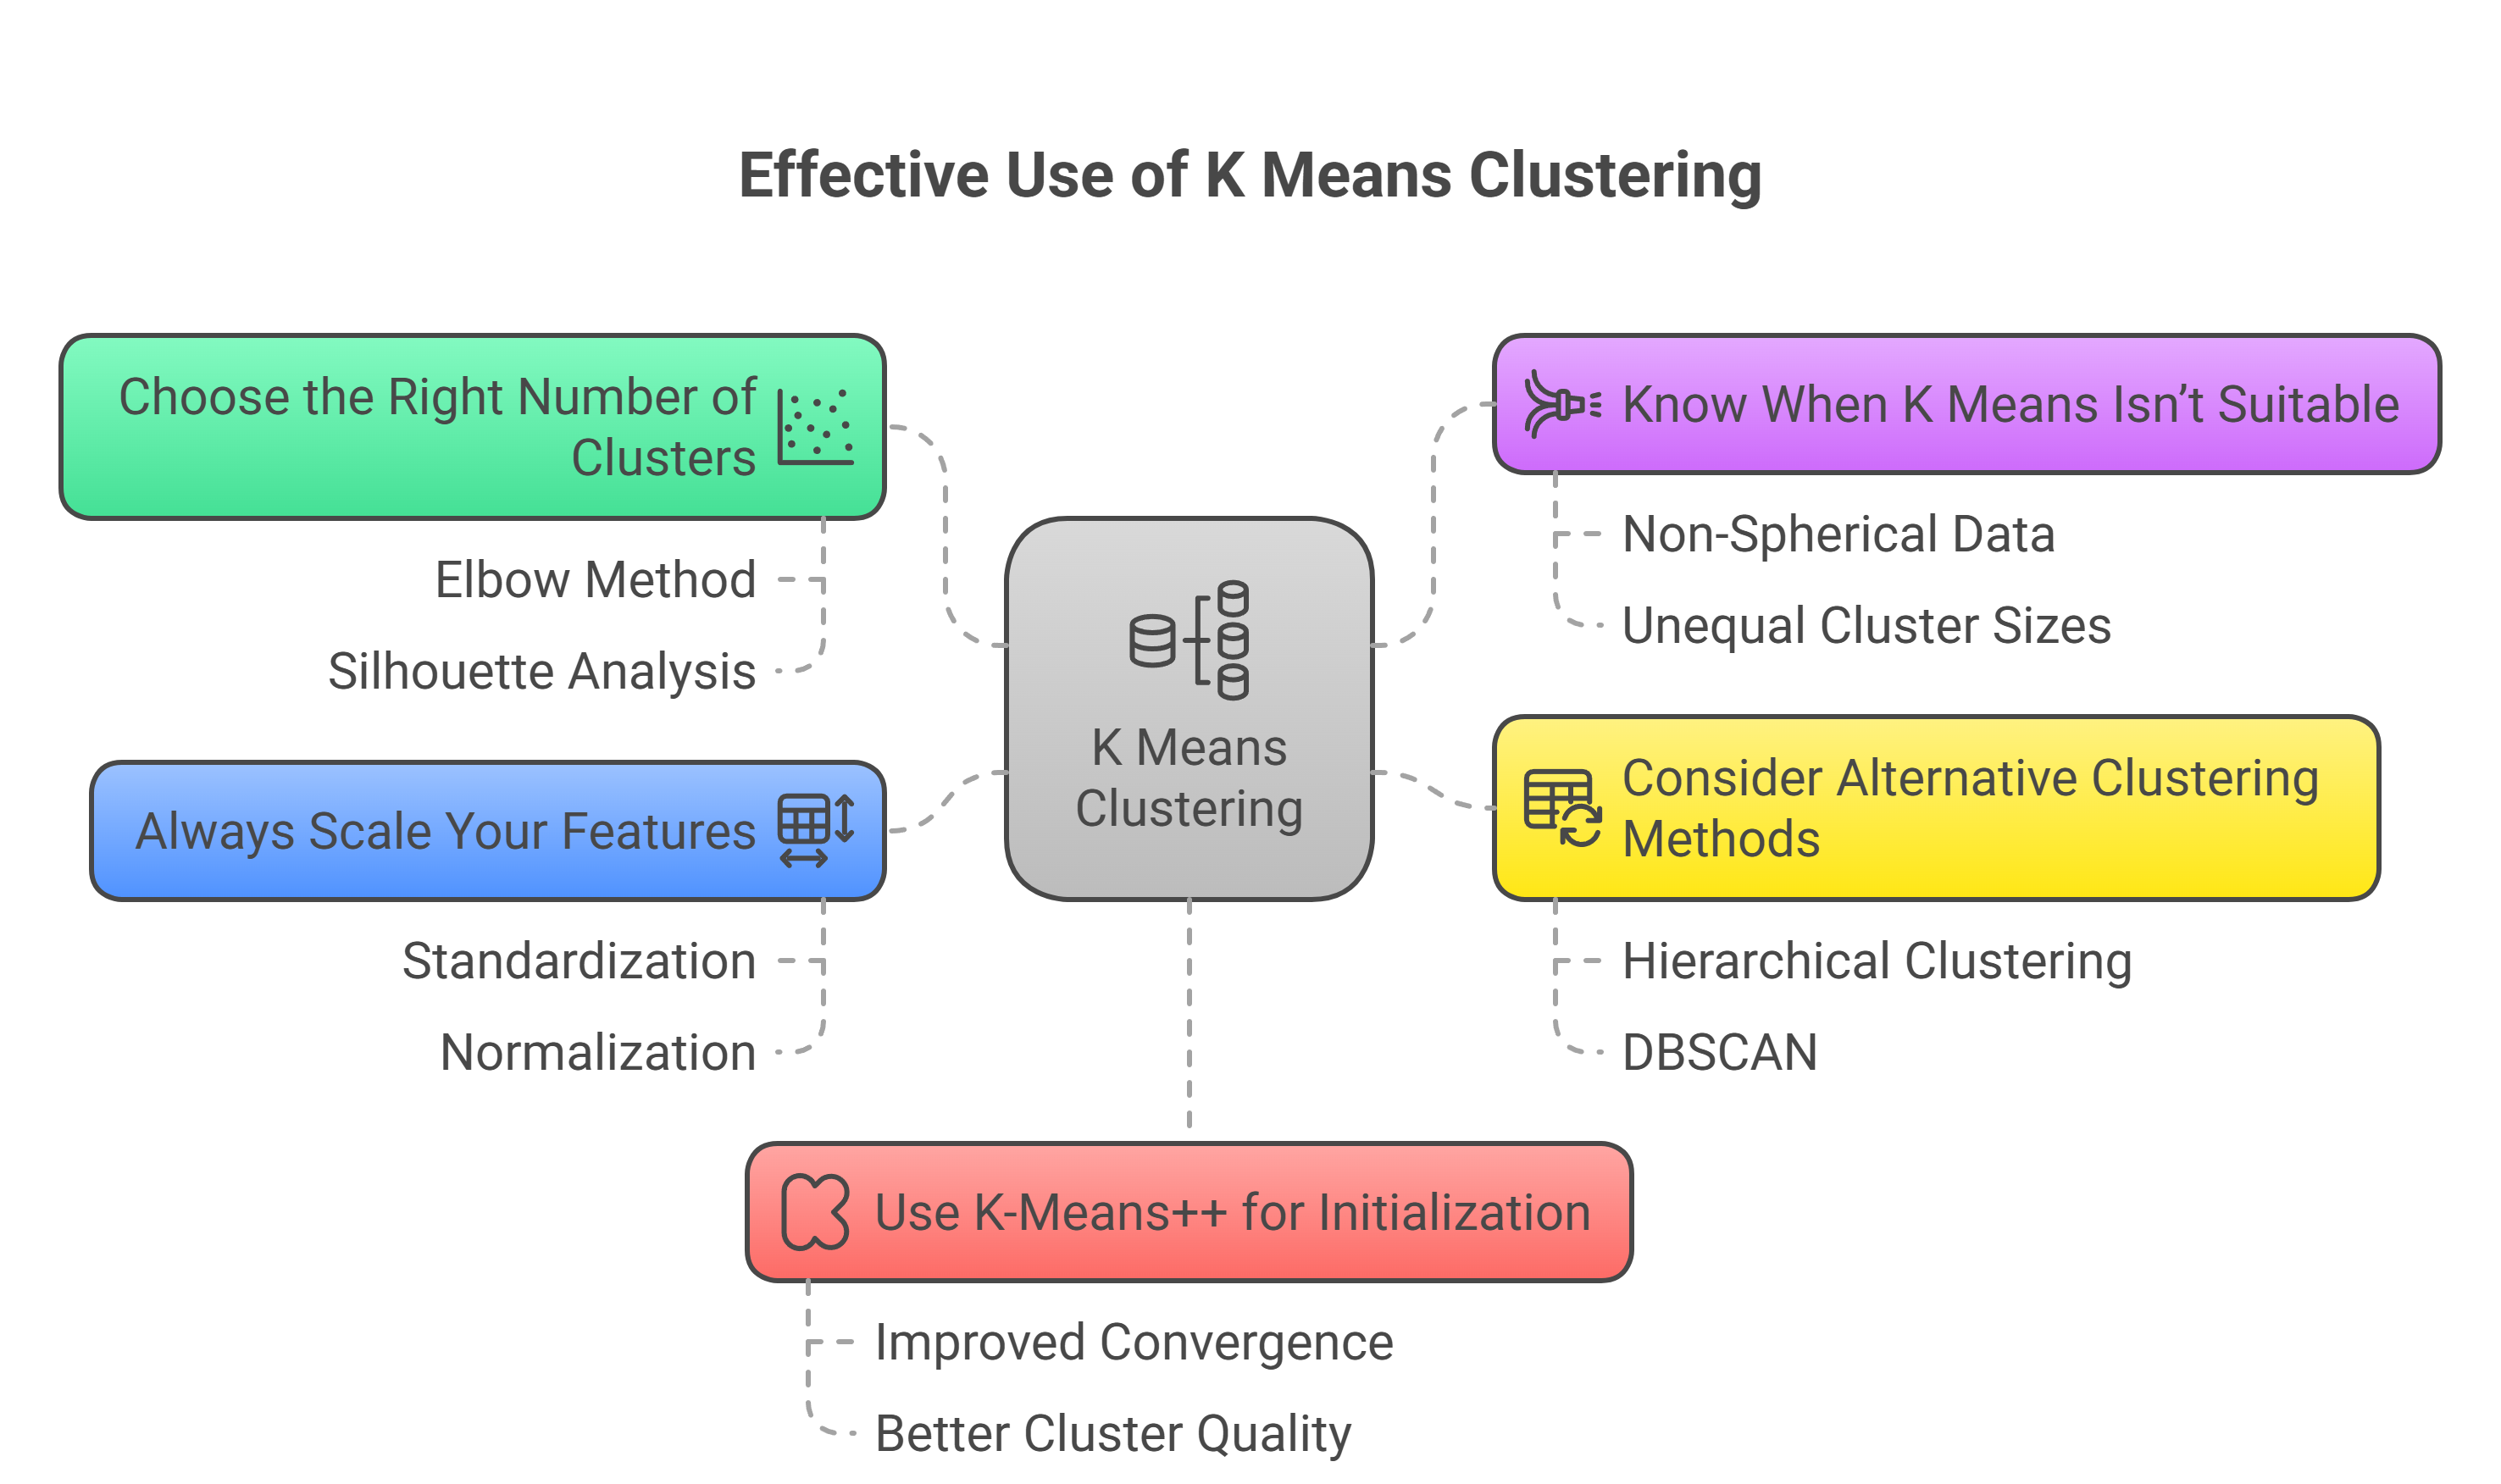
Here are five tips to effectively use K-means clustering in machine learning:
1. Choose the Right Number of Clusters (K)
Accurate cluster count selection critically influences intra-cluster cohesion and overall model interpretability. Common methods include:
- Elbow Method: Detects the point where increasing K yields diminishing WCSS reduction, balancing complexity and fit.
- Silhouette Score: Quantifies how well samples align with assigned clusters versus neighboring ones, guiding optimal K.
- Domain Knowledge: Incorporates expert understanding to select K aligned with inherent data groupings.
Example: If sales data separates customers into budget categories, setting K=3 enables precise segment targeting.
2. Know When K Means Isn’t Suitable
K Means assumes isotropic clusters with similar densities, limiting effectiveness on complex geometries and noisy data. It performs poorly with:
- Non-convex or irregular clusters: Complex shapes cannot be accurately captured.
- Varying densities and outliers: Lead to improper cluster assignments and sensitivity to noise.
Example: Analyzing spatial data with elongated or nested regions requires alternative methods beyond K Means.
3. Consider Alternative Clustering Methods
When K Means’ assumptions fail, alternative algorithms better handle complex data structures:
- DBSCAN: Density-based method that identifies arbitrarily shaped clusters and filters noise without specifying K.
- Hierarchical Clustering: Builds nested clusters for exploratory analysis of small to medium datasets.
Example: DBSCAN often provides more robust segmentation than K Means for churn analysis with sparse, noisy behavioral data.
4. Always Scale Your Features
Feature scaling standardizes magnitudes, preventing dominance by variables with larger ranges during distance calculations.
Here’s what you can apply:
- StandardScaler: Normalizes features to zero mean and unit variance for balanced clustering.
- MinMaxScaler: Rescales features to a fixed range, preserving relative differences.
Example: Unscaled income data can overshadow purchase frequency, biasing cluster results.
5. Use K-Means++ for Initialization
K-Means++ optimizes initial centroid placement to improve convergence and cluster quality:
- Minimizes local minima risk: By selecting dispersed starting points in feature space.
- Accelerates convergence: Reduces iterations needed to stabilize clusters.
Example: K-Means++ reduces the chances of poor clustering due to unfavorable centroid seeds, enhancing reliability.
Also read: Top 25+ Machine Learning Projects for Students and Professionals To Expertise in 2025
Test Your K Means Clustering Expertise with This Quiz!
1. What is the main objective of K Means clustering?
a) Minimize inter-cluster variance
b) Minimize intra-cluster variance
c) Maximize cluster size
d) Maximize inter-cluster variance
2. Which of the following methods is used to select the optimal number of clusters (K) in K Means?
a) Silhouette Score
b) Elbow Method
c) Both a and b
d) t-SNE
3. What is the key assumption K Means makes about the shape of clusters?
a) Clusters are irregularly shaped
b) Clusters are spherical and equally sized
c) Clusters are elliptical
d) Clusters are not connected
4. What is a major limitation of K Means clustering?
a) It is highly effective with irregularly shaped clusters
b) It requires labeled data
c) It requires the number of clusters (K) to be predefined
d) It works well with categorical data
5. Which distance metric is typically used by K Means to measure similarity between data points and centroids?
a) Cosine similarity
b) Euclidean distance
c) Jaccard similarity
d) Manhattan distance
6. What happens if K is set too high in K Means clustering?
a) Clusters will merge together
b) The model will underfit the data
c) The model will overfit, creating too many small clusters
d) The clusters will become non-spherical
7. What is the role of the random_state parameter in the K Means algorithm?
a) It controls the number of iterations
b) It initializes the centroids randomly
c) It sets the number of clusters
d) It ensures reproducibility of results
8. In which situation would K Means clustering NOT be effective?
a) When data has outliers
b) When clusters are of different densities
c) When clusters have non-convex shapes
d) All of the above
9. Which of the following algorithms can be used as an alternative to K Means for clustering with arbitrary shaped clusters?
a) DBSCAN
b) Linear Regression
c) Decision Trees
d) Random Forests
10. After performing K Means, which metric would you use to evaluate the quality of the clusters?
a) R-squared
b) Silhouette Score
c) Confusion Matrix
d) Accuracy
Also Read: Understanding the Role of Anomaly Detection in Data Mining
Conclusion
K Means Clustering is a powerful unsupervised learning algorithm that helps group similar data points into clusters, minimizing variance within each cluster. It is widely used in machine learning and data mining applications, such as customer segmentation, anomaly detection, and bioinformatics.
To get the best results, always ensure you choose the right K value, scale your data, and evaluate your clusters using metrics like the silhouette score.
If you're looking to enhance your skills in machine learning and data mining, upGrad offers the perfect courses to help you excel. Here are some of the additional in-demand courses from upGrad:
- Executive Diploma in Machine Learning & AI
- Executive Post Graduate Certificate Programme in Data Science & AI
- Learn Python Libraries: NumPy, Matplotlib & Pandas
Curious which courses can help you gain expertise in machine learning operations? Contact upGrad for personalized counseling and valuable insights. For more details, you can also visit your nearest upGrad offline center.
FAQs
1. How does K Means clustering perform on high-dimensional feature spaces with correlated variables?
K Means relies on Euclidean distance, which becomes less effective as dimensionality increases due to the "curse of dimensionality." You should apply dimensionality reduction techniques like PCA or t-SNE to decorrelate features and reduce the dimensionality space before clustering. These methods help you preserve meaningful variance and local structures, making interpreting clusters easier. By preprocessing your data this way, you ensure that K Means identifies actual patterns rather than noise in high-dimensional spaces.
2. Why is feature normalization using StandardScaler or MinMaxScaler critical before K Means clustering?
K Means calculates cluster membership based on distances, so features with larger scales disproportionately influence clustering outcomes. You must normalize or standardize your data to ensure that no single feature dominates the distance metric. When you apply StandardScaler or MinMaxScaler, you balance the variables' scale, improving cluster quality and convergence speed. This preprocessing step is essential to achieve meaningful, stable clusters in your analyses.
3. How does K Means++ centroid initialization affect convergence in Lloyd’s algorithm?
K Means++ improves upon random initialization by selecting centroids that are well spaced apart, which prevents poor local minima traps during clustering. When you use K Means++, you reduce the number of iterations needed for convergence, making the algorithm more efficient. This method enhances the stability and repeatability of your results by ensuring initial centroids represent diverse data regions. You’ll find that K Means++ often produces higher quality clusters, especially with complex datasets.
4. When is density-based clustering like DBSCAN preferred over centroid-based K Means?
DBSCAN is designed to identify clusters of arbitrary shape and varying density, whereas K Means assumes spherical, equally sized clusters. You should consider DBSCAN if your data contains noise or outliers, as it treats those as separate from clusters. When you use DBSCAN, you don’t need to specify the number of clusters in advance, which is helpful for exploratory data analysis. This makes DBSCAN a more flexible choice when your data structure doesn’t meet K Means’ assumptions.
5. What quantitative metrics validate cluster cohesion and separation in K Means?
The silhouette score measures how similar each point is to its cluster compared to others, providing a clear indication of cluster quality. When calculating the silhouette score, values closer to 1 suggest well-separated and cohesive clusters, while values near 0 indicate overlapping clusters. This metric helps you objectively evaluate your clustering results and decide the optimal number of clusters. Using silhouette scores alongside visualizations improves your confidence in interpreting clustering outputs.
6. How does random_state influence K Means reproducibility and cluster stability?
K Means uses random initialization for centroids unless you fix the random_state parameter, which controls the seed for reproducibility. When you set a fixed random_state, you ensure that your clustering results are consistent across multiple runs. This consistency is crucial when you need reliable and repeatable results for comparison or production deployment. Without fixing random_state, you may get different clusters each time, making your findings harder to validate.
7. Can Mini-Batch K Means support real-time or streaming data clustering?
Mini-Batch K Means processes small, random subsets of data in each iteration, enabling faster approximate clustering compared to the standard algorithm. If you work with streaming data or require near real-time updates, Mini-Batch K Means helps you maintain performance while handling large volumes. You can tune the batch size to balance speed and clustering accuracy according to your use case. This makes Mini-Batch K Means a practical choice for scalable, online machine learning applications.
8. How does K Means computational complexity compare with hierarchical clustering in big data contexts?
K Means has a linear time complexity relative to data size, number of clusters, and iterations, making it suitable for large datasets. You should prefer K Means over hierarchical clustering when working with millions of samples, as hierarchical methods scale quadratically or worse. While hierarchical clustering provides more detailed data structure, its computational demands limit its use for big data. Choosing K Means ensures that you can cluster large datasets efficiently without prohibitive computational costs.
9. What approaches help determine the optimal number of clusters K in absence of domain knowledge?
You can combine the elbow method, which looks for diminishing returns in WCSS reduction, with the silhouette score that measures cluster separation quality. When you plot these metrics, look for inflection points or peaks that indicate the best trade-off between model complexity and fit. This approach removes guesswork and grounds your K selection in objective data-driven criteria. Applying these methods improves your clustering results, even if you lack prior knowledge about the data’s structure.
10. What preprocessing steps are essential for effective K Means clustering in noisy, real-world datasets?
Start by handling missing values with imputation and encoding categorical variables numerically to prepare consistent input for clustering. You should normalize your features and consider dimensionality reduction techniques like PCA to reduce noise and feature correlation. Detecting and removing outliers is also critical because K Means is sensitive to noisy data points. Proper preprocessing enhances the algorithm’s ability to find meaningful, stable clusters in practical applications.
11. How does integrating K Means with PCA or t-SNE enhance visualization in machine learning pipelines?
PCA and t-SNE reduce high-dimensional data into two or three dimensions, preserving variance or local neighborhood structure, respectively. Applying these techniques before or after clustering enables intuitive visual interpretation of complex cluster relationships. This combination helps you validate cluster quality and uncover hidden patterns that might be missed in raw high-dimensional space. Visual insights from these plots guide more informed data-driven decisions in your workflows.


upGrad Learner Support
Talk to our experts. We are available 7 days a week, 10 AM to 7 PM
Indian Nationals
Foreign Nationals
Disclaimer
The above statistics depend on various factors and individual results may vary. Past performance is no guarantee of future results.
The student assumes full responsibility for all expenses associated with visas, travel, & related costs. upGrad does not .