All courses
Agentic AI
Agentic AI
Artificial Intelligence
Degree / Exec. PG

IIIT Bangalore
Executive Diploma in Machine Learning and AI
OPJ Global University
Master’s Degree in Artificial Intelligence and Data Science
Liverpool John Moores University
Master of Science in Machine Learning & AI
Golden Gate University
DBA in Emerging Technologies with Concentration in Generative AIExecutive Certificate

IIITB & IIM, Udaipur
Chief Technology Officer & AI Leadership Programme
IIIT-B & IIM, Udaipur
Chief Data and AI Officer Programme
IIIT Bangalore
Executive Programme in Generative AI for Leaders
upGrad | Microsoft
Gen AI Mastery Certificate for Software DevelopmentOffline Bootcamps

upGrad
Data Science and AI-MLDoctorate
For All Domains
IIITB & IIM, Udaipur
Chief Technology Officer & AI Leadership Programme
Swiss School of Business and Management
Global Doctor of Business Administration from SSBM
Edgewood University
Doctorate in Business Administration by Edgewood UniversityGolden Gate University
Doctor of Business Administration From Golden Gate University
Rushford Business School
Doctor of Business Administration from Rushford Business School, Switzerland-d9bdeff6165f4eb1ba2adcebde78e961.svg)
University of Waterloo
Chief Technology and AI Officer ProgramLeadership / AI
Golden Gate University
DBA in Emerging Technologies with a concentration in Generative and Agentic AIMachine Learning
Machine Learning
Data Science
Degree / Exec. PG
O.P Jindal Global University
Master’s Degree in Artificial Intelligence and Data ScienceIIIT Bangalore
Executive Diploma in Data Science & AILiverpool John Moores University
Master of Science in Data ScienceExecutive Certificate
upGrad | Microsoft
Gen AI Foundations Certificate Program from MicrosoftIIIT-B & IIM, Udaipur
Chief Data and AI Officer ProgrammeupGrad | Microsoft
Gen AI Mastery Certificate for Data AnalysisupGrad | Microsoft
Gen AI Mastery Certificate for Software DevelopmentupGrad | Microsoft
Gen AI Mastery Certificate for Managerial ExcellenceupGrad | Microsoft
Gen AI Mastery Certificate for Content CreationOffline Bootcamps
upGrad
Data Science and AI-MLMBA
Masters

Liverpool John Moores University
Master of Business Administration from Liverpool John Moores University (LJMU) with IIM Udaipur CertificationO.P.Jindal Global University
MBA (with Career Acceleration Program by upGrad)Edgewood University
MBA from Edgewood UniversityO.P.Jindal Global University
MBA from O.P.Jindal Global UniversityExecutive Certificate

IMT, Ghaziabad
Advanced General Management ProgramMarketing
Executive Certificate
upGrad | Microsoft
Gen AI Foundations Certificate Program from MicrosoftupGrad | Microsoft
Gen AI Mastery Certificate for Content CreationOffline Bootcamps
upGrad
Digital MarketingManagement
Degree
O.P Jindal Global University
MSc in International Accounting & Finance (ACCA integrated)
Golden Gate University
Master of Arts in Industrial-Organizational PsychologyExecutive Certificate
IIIT-B & IIM, Udaipur
Chief Technology Officer & AI Leadership ProgrammeIIIT-B & IIM, Udaipur
Chief Data and AI Officer Programme
IIM Kozhikode
Human Resource Analytics Course from IIM-KupGrad | Microsoft
Gen AI Foundations Certificate Program from MicrosoftEducation
Education

Northeastern University
Master of Education (M.Ed.) from Northeastern UniversityEdgewood University
Doctor of Education (Ed.D.)Edgewood University
Master of Education (M.Ed.) from Edgewood UniversityCertifications
Project Management
Certification

Knowledgehut
Leadership And Communications In ProjectsKnowledgehut
Microsoft Project 2007/2010-ae8d039bbd2a41318308f8d26b52ac8f.svg)
Knowledgehut
Financial Management For Project ManagersKnowledgehut
Fundamentals of Earned Value Management (EVM)Knowledgehut
Fundamentals of Portfolio ManagementKnowledgehut
Fundamentals of Program Management-35c169da468a4cc481c6a8505a74826d.webp&w=128&q=75)
Knowledgehut
CAPM® CertificationsKnowledgehut
Microsoft® Project 2016Certifications & Trainings
-7f4b4f34e09d42bfa73b58f4a230cffa.webp&w=128&q=75)
Knowledgehut
PMP® CertificationKnowledgehut
PMI-RMP® CertificationKnowledgehut
PMP Renewal Learning PathKnowledgehut
Oracle Primavera P6 V18.8Knowledgehut
Microsoft® Project 2013Knowledgehut
PfMP® Certification CourseKnowledgehut
Project Planning and MonitoringPrince2 Certifications

Knowledgehut
PRINCE2® FoundationKnowledgehut
PRINCE2® PractitionerKnowledgehut
PRINCE2 Agile Foundation and PractitionerKnowledgehut
PRINCE2 Agile® Foundation CertificationKnowledgehut
PRINCE2 Agile® Practitioner CertificationManagement Certifications
Knowledgehut
Project Management Masters Certification ProgramKnowledgehut
Change ManagementKnowledgehut
Project Management TechniquesKnowledgehut
Product Management Certification ProgramKnowledgehut
Project Risk Management- Study abroad
- Offline centres
- uGSOT - B.Tech
More
%20(2)-db0b6f38da9c485faf76e366793c9b9e.webp&w=128&q=75)


48. Variance in ML
K-Medoids Clustering Explained: Difference Between K Means and K-Medoids
Did you know? In situations with significant noise or outliers, K-Medoids can outperform K-Means regarding clustering accuracy. Studies have shown that for datasets containing just 10-15% outliers, the error rate of K-Means can be more than double that of K-Medoids in identifying the true underlying clusters.
Hierarchical clustering excels at uncovering the inherent structure within data by building a hierarchy of clusters, a contrast to partitioning methods like K-Means. While K-Means clustering defines cluster centers as the mean of the data points within a cluster, a sensitive measure to outliers, K-Medoids distinguishes itself by selecting actual data points as cluster centers, known as medoids. This makes K-Medoids inherently more robust when dealing with noisy data or outliers.
The choice between these algorithms hinges on the dataset's characteristics and the desired robustness to extreme values. Our comprehensive exploration will cover the various types of hierarchical clustering, key algorithms, and robust evaluation techniques!
Deepen your understanding of algorithms like K-Medoids and K-Means! Explore upGrad's comprehensive online AI and ML programs to master clustering techniques and build robust machine learning models for complex data analysis.
What Is K-Medoids Clustering? Definition, Algorithm, and Key Features
K-Medoids clustering is a partitioning clustering algorithm that divides a dataset into k distinct, non-overlapping clusters. Unlike K-Means, which uses the mean data points within a cluster (the centroid) as its representative center, K-Medoids selects actual data points as cluster centers.
Key Characteristics of K-Medoids:
- Uses actual data points as cluster centers (medoids), not calculated centroids.
- Aims to minimize the sum of dissimilarities between each data point and the medoid of its assigned cluster.
- More robust to outliers and noise than K-Means, since medoids are less influenced by extreme values.
Importance of the Distance Matrix:
- K-Medoids relies heavily on a distance matrix to calculate dissimilarities between points.
- A distance matrix is an n×n symmetric table where:
- n is the number of data points.
- The cell at row i, column j represents the distance between data point i and data point j.
- This matrix forms the basis for identifying the most central data point (medoid) in each cluster.
Categorical Data: Dissimilarity can be measured using metrics like:
- Hamming distance: The number of positions at which the corresponding symbols differ.
- Jaccard index: Measures the similarity between two sets. 1 Dissimilarity is 1 - (intersection size/union size).
The K-Medoids clustering algorithm typically follows these steps:
- Initialization: Randomly select k data points from the dataset as initial medoids.
- Assignment: Based on a chosen distance metric, assign each remaining data point to the cluster whose current medoid is the most similar (closest) to it.
- Medoid Update: For each cluster, identify the data point that minimizes the total dissimilarity to all other points in the cluster. This point becomes the new medoid for that cluster.
- Iteration: Repeat the assignment and medoid update steps until the medoids no longer change, or a predefined number of iterations is reached.
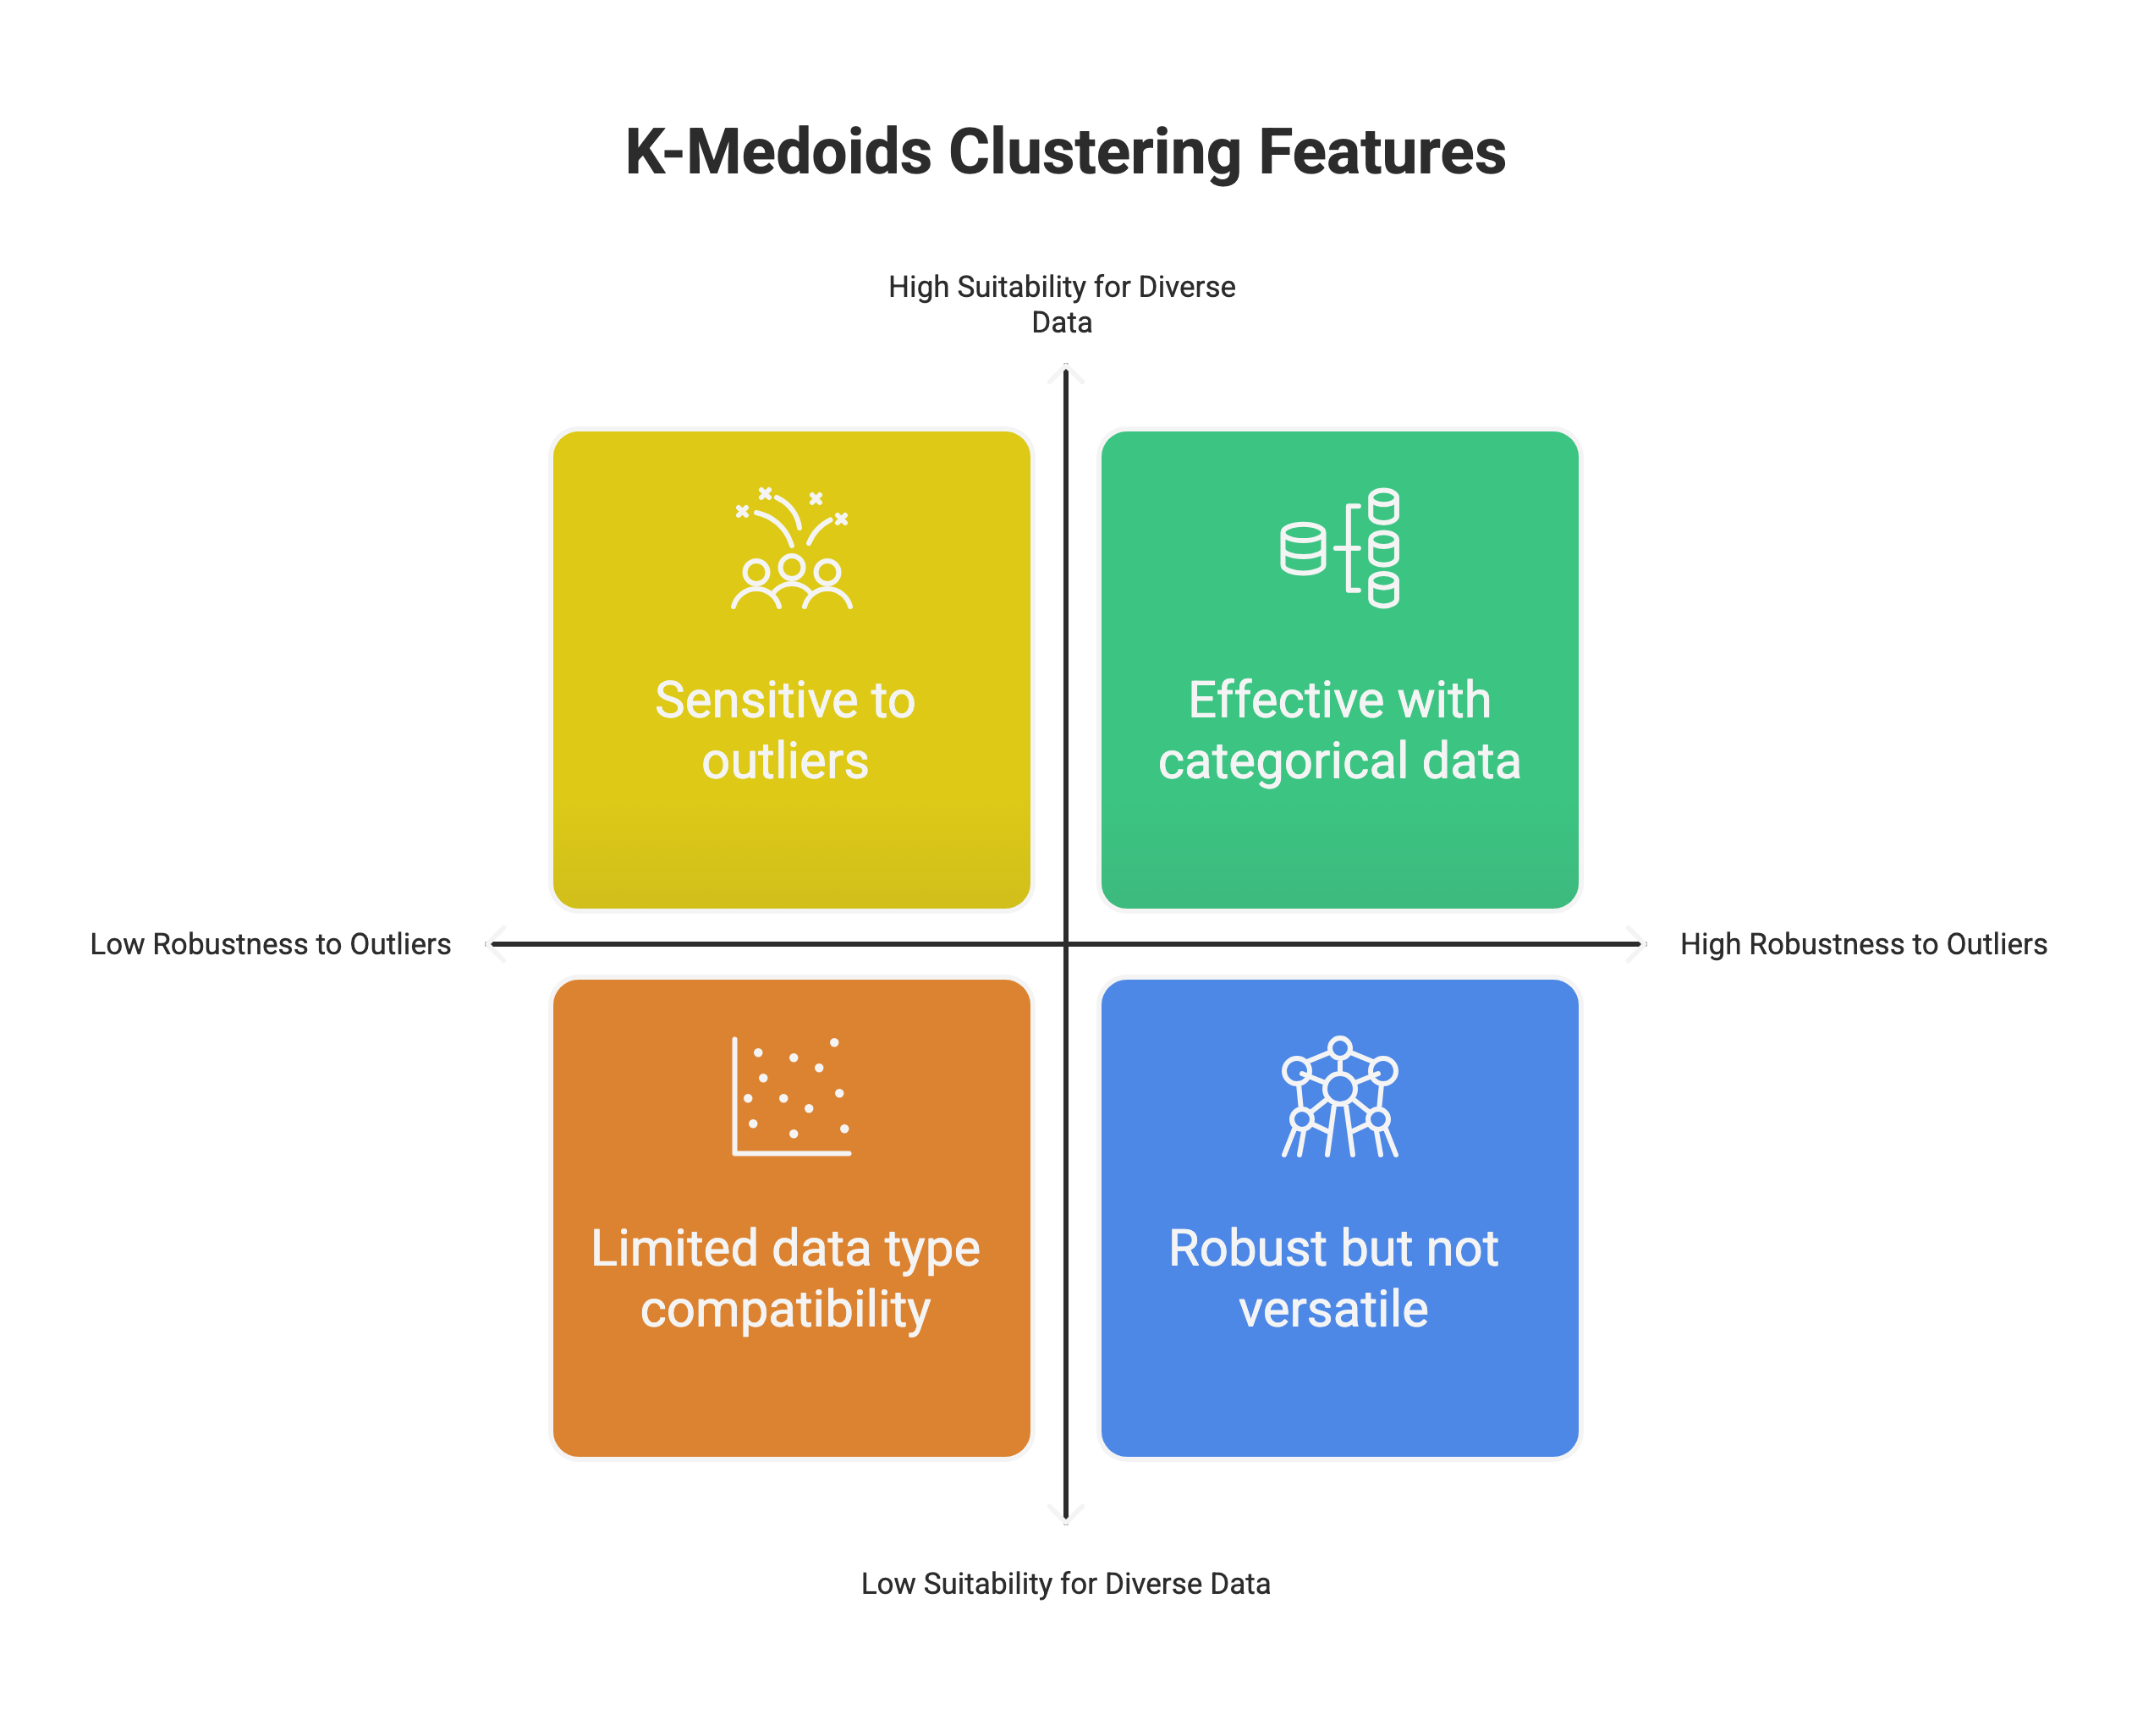
Key Features of K-Medoids Clustering:
- Robustness to Outliers: Because medoids are actual data points, the algorithm is less sensitive to outliers than K-Means, where outliers can significantly influence the position of centroids.
- Suitability for Diverse Data: K-Medoids can work effectively with categorical data or any data where a distance or dissimilarity matrix can be defined, as it relies on pairwise distances rather than means.
- Use of Distance Matrix: Unlike K-Means, which implicitly uses Euclidean distance and operates directly on the feature vectors, K-Medoids explicitly uses a distance (or dissimilarity) matrix, allowing for greater flexibility in defining relationships between data points.
To further enhance your understanding of clustering techniques, including K-Medoids and its practical applications, explore these highly recommended programs in Artificial Intelligence and Machine Learning:
- Masters in Artificial Intelligence and Machine Learning
- Executive Diploma in Machine Learning and AI
- Master’s Degree in Artificial Intelligence and Data Science
K-Medoids clustering offers a robust alternative to K-Means. Using actual data points as cluster representatives makes it less susceptible to outliers and applicable to diverse data types through a distance matrix.
Also Read: Clustering in Machine Learning: Learn About Different Techniques
How the K-Medoids Clustering Algorithm Works? A Step-by-Step Guide
In this section, you'll discover the step-by-step process that defines the K-Medoids algorithm. You'll learn how it initializes by selecting medoids, then iteratively assigns data points to these representatives and refines the medoid selection to minimize cluster dissimilarity. This detailed breakdown will clarify the algorithm's mechanics.
1. Initialization:
Randomly select k data points from the dataset as initial medoids. Let's call the current medoids M={m1,m2,...,mk}, where each mi is a data point.
While straightforward, this random initialization can have implications. Especially in datasets with noise or outliers, a randomly chosen medoid might be an extreme value, potentially leading to suboptimal initial clusters. This can affect the algorithm's convergence speed and the quality of the final clustering.
2. Assignment:
For each data point pi in the dataset (that is not a medoid), assign it to the cluster whose medoid mj∈M is closest to it based on a chosen distance metric d(pi,mj). This assignment aims to minimize the distance of each point to its cluster's representative.
3. Swap and Update (Iterative Refinement):
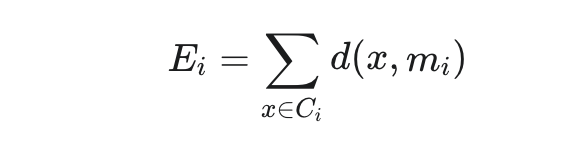
This is the core of the algorithm's iterative improvement. For each cluster Ci and for each data point h in Ci that is not currently the medoid mi, consider swapping mi with h. Calculate the total dissimilarity (sum of distances) of all points in Ci to this new potential medoid h.
If this total dissimilarity is lower than the total dissimilarity with the current medoid mi, then update cluster Ci's medoid to h. This process is repeated for all clusters and all non-medoid points within each cluster in each iteration. This step aims to minimize the total dissimilarity within each cluster.
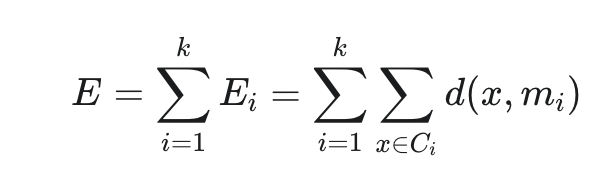
The total dissimilarity for a cluster Ci with medoid mi is calculated as:
The algorithm aims to minimize the total dissimilarity across all clusters:
Distance Matrix Illustration (Conceptual):
Imagine a table where both rows and columns represent your data points. Each cell (i,j) in this table contains the distance between data points i and j. The K-Medoids clustering algorithm uses these pairwise distances to determine the best medoids and assign cluster points.
| Data Point | Point 1 | Point 2 | Point 3 | ... | Point N |
|------------|---------|---------|---------|-----|---------|
| Point 1 | 0 | d₁₂ | d₁₃ | ... | d₁N |
| Point 2 | d₂₁ | 0 | d₂₃ | ... | d₂N |
| Point 3 | d₃₁ | d₃₂ | 0 | ... | d₃N |
| ... | ... | ... | ... | 0 | ... |
| Point N | dN₁ | dN₂ | dN₃ | ... | 0 |
Here, dij represents the distance between data points i and j.
4. Termination:
The algorithm stops when the medoids no longer change after an iteration or when a predefined stopping criterion (e.g., maximum number of iterations) is met. A common variant of the K-Medoids algorithm is PAM (Partitioning Around Medoids). PAM is a specific implementation that systematically tries all possible swaps of medoids with non-medoids to find the configuration that minimizes the total dissimilarity.
Now, let's consider the efficiency of this approach.
Computational Complexity of K-Medoids Clustering
The computational complexity of the basic K-Medoids clustering algorithm, particularly the PAM implementation, is generally higher than that of K-Means. In each iteration, for each k cluster, and for each non-medoid point within that cluster, the algorithm calculates the total dissimilarity if that point were to become the new medoid.
If n is the number of data points and k is the number of clusters, a naive implementation of PAM can have a time complexity of approximately O(k(n−k)2) per iteration. Since the number of iterations can also be significant in some cases, the overall complexity can become relatively high, especially for large datasets.
Impact on Usability:
- Smaller Datasets: For datasets with a relatively small number of data points, the higher computational cost of K-Medoids might be acceptable, especially when robustness to outliers or using non-Euclidean distances is crucial.
- Larger Datasets: As data points increase, the computational time for K-Medoids can become prohibitive. In such scenarios, K-Means or other more scalable clustering algorithms might be preferred, or more efficient variants of K-Medoids clustering might be considered.
The slower speed of K-Medoids clustering is a trade-off for its advantages in handling outliers and diverse data types. Understanding this complexity is essential when choosing the appropriate clustering algorithm for a given task and dataset size.
Master the power of unsupervised learning and clustering techniques like K-Medoids! Explore upGrad's comprehensive program on Unsupervised Learning: Clustering, trusted by over 11,000 learners, offers 11 hours of in-depth knowledge and practical skills, including clustering algorithms, Google Analytics integration for cluster analysis, and data cleaning.
Also Read: Types of Regression in Machine Learning: 18 Advanced Models
What is K-means Clustering? Algorithm and Core Concepts
K-Medoids offers robustness through its use of medoids, which are actual data points used as cluster centers. In contrast, K-Means clustering is a widely adopted and efficient unsupervised learning algorithm that partitions data into a pre-defined number (K) of clusters using centroids, the mean of data points within a cluster.
This fundamental distinction makes K-Medoids more resilient to the influence of outliers, as medoids are actual data points and are less affected by extreme values. K-Means, on the other hand, operates by iteratively assigning data points to the nearest centroid and then recalculating the centroids to minimize within-cluster variance.
How does the K-Means Clustering Algorithm Work?
In this section, you'll learn the K-Means algorithm's step-by-step process. We'll break down how it starts with initial guesses for cluster centers and then iteratively refines these centers by assigning data points and recalculating means until stable clusters are formed.
%20How%20the%20K-Means%20Clustering%20Algorithm%20Works%20-%20visual%20selection%20(1)-6085b1dcfb5e47d4bd99bf819f5f8683.png)
- Initialization: The algorithm begins by randomly selecting K data points from the dataset to serve as the initial centroids (the centers of the clusters). Think of this as randomly placing K pins on a map of your data.
- Assignment: Each data point in the dataset is assigned to the cluster whose centroid is closest to it, typically based on the Euclidean distance. Imagine drawing lines from each data point to every pin and assigning the point to the pin it's closest to.
- Update: Once all data points have been assigned to clusters, the algorithm recalculates the position of each centroid. The new centroid becomes the mean of all the data points assigned to that cluster. This is like finding the new center of gravity for all the points associated with each pin.
- Iteration: Steps 2 and 3 are repeated iteratively. Data points are reassigned based on the new centroid positions, and the centroids are recalculated based on the new cluster memberships. This process continues until the centroids no longer move significantly, indicating that the algorithm has converged and the clusters are relatively stable.
Also Read: Everything You Need to Know About Binary Logistic Regression
Elevate your data analysis skills by mastering inferential statistics! Explore upGrad's comprehensive program on the Basics of Inferential Statistics, trusted by over 18,000 learners. Invest 15 hours in learning essential concepts like probability and statistical inference, crucial for effective data analytics
Key Considerations and Limitations of K Means
While K-Means is a robust and widely used algorithm, it's essential to be aware of its limitations in order to apply it effectively. Let's explore common challenges when using K-Means and understand why they matter in practice.
Aspect | Description | Example |
Sensitivity to Outliers | Centroids are based on the mean, so outliers can significantly distort cluster centers. K-Medoids are less affected by using medoids instead of means. | A single customer making a huge purchase skews the centroid of the spending cluster, misrepresenting typical spending behavior. |
Impact of Initial Centroid Selection | Random starting points can lead to different clustering results. Poor initialization might lead to suboptimal clustering. | Starting centroid placement in different areas on a data map can lead to drastically different groupings. Re-running the algorithm can help find better groupings. |
Assumption of Spherical Clusters | K-Means assumes clusters are spherical and similar in size, using Euclidean distance as a measure. It struggles with irregularly shaped or unequal-sized clusters. | Clustering customer browsing behavior might result in varied, non-spherical clusters, which K-Means fails to capture accurately. |
Reliance on Euclidean Distance | K-Means uses Euclidean distance, which might not be suitable for all data types, especially high-dimensional or text-based data. | Clustering documents by topic might require cosine similarity, which captures semantic similarity better than straight-line distance. |
Convergence to Local Minima | K-Means might settle in a local minimum rather than the optimal clustering. Multiple runs can yield different results, and within-cluster variance (WCSS) evaluation can help assess clustering quality. | Running K-Means multiple times on the same dataset may result in different clusters; not all are equally effective in minimizing intra-cluster distances. |
By understanding these limitations, you can make more informed decisions about when to use K-Means and how to interpret its results. You can also recognize scenarios where an algorithm like K-Medoids Clustering might be more suitable.
Also Read: Guide to Decision Tree Algorithm: Applications, Pros & Cons
Here are some solutions to the limitations of K-Means clustering:
1. Sensitivity to Outliers:
- K-Medoids: Use K-Medoids instead of K-Means. K-Medoids uses actual data points (medoids) as cluster centers, making it less sensitive to outliers than the mean-based centroids in K-Means.
- Outlier Removal/Preprocessing: Identify and remove or downweight outliers before applying K-Means. Techniques like winsorizing or using robust scaling methods can help.
2. Impact of Initial Centroid Selection:
- Multiple Initializations: Run the K-Means algorithm multiple times with different random initializations of centroids. Evaluate the results (e.g., using WCSS) and choose the clustering with the best score.
- K-Means++ Initialization: Use a smarter initialization technique like K-Means++. This method strategically selects initial centroids that are far from each other, increasing the likelihood of finding a better clustering.
3. Assumption of Spherical Clusters and Euclidean Distance:
- Feature Scaling: Standardize or normalize the data (e.g., using StandardScaler or MinMaxScaler) so that all features contribute equally to the Euclidean distance calculation. This can help when clusters have different variances across dimensions.
- Transforming Data: Apply non-linear transformations to the data to make the clusters more spherical or linearly separable.
- Alternative Distance Metrics: Use distance metrics other than Euclidean distance that are more appropriate for the data's structure (e.g., Manhattan distance, cosine distance, Jaccard distance).
- Density-Based Clustering: Consider density-based clustering algorithms like DBSCAN or HDBSCAN, which can identify clusters of arbitrary shapes and sizes.
- Other Clustering Algorithms: Explore other algorithms like Gaussian Mixture Models (GMMs) which can model non-spherical clusters using covariance matrices, or spectral clustering which can handle complex cluster shapes.
4. Reliance on Euclidean Distance for Similarity:
- Use Appropriate Similarity Measures: For data where Euclidean distance is not meaningful (e.g., text data), use similarity measures like cosine similarity and adapt the clustering algorithm or use algorithms designed for such data (e.g., K-Modes for categorical data).
- Kernel Methods: Apply kernel methods to transform the data into a space where Euclidean distance might better reflect the underlying similarities.
5. Potential for Convergence to Local Minima:
- Multiple Runs: As mentioned before, run K-Means multiple times with different initializations.
- Higher Number of Iterations: Increase the maximum number of iterations allowed for the K-Means algorithm to converge, giving it more chances to escape local minima.
- More Sophisticated Algorithms: Consider using algorithms less prone to local minima, such as hierarchical clustering or some variations of K-Means.
- Evaluate Clustering Quality: Use evaluation metrics like the Silhouette Score or Davies-Bouldin Index to assess the quality of the resulting clusters from different runs and choose the best one.
Difference Between K Means and K Medoids: A Structured Comparison
In this section, you'll gain a clear understanding of the fundamental distinctions between K-Means and K-Medoids. We'll dissect their core mechanisms, particularly how they represent cluster centers, and analyze how these differences impact their sensitivity to outliers, use of distance metrics, computational demands, and the interpretability of their results.
This structured comparison will illuminate when to favor one algorithm over another in your clustering tasks.
Feature | K-Means | K-Medoids |
Type of Center | Centroid (mean of cluster points) | Medoid (actual data point within the cluster) |
Sensitivity to Outliers | High | Low (more robust) |
Distance Metric Usage | Typically Euclidean distance | Flexible; any distance metric can be used |
Computational Complexity | Generally O(nkI), efficient for large n | Generally higher, around O(k(n−k)2I) for PAM |
Interpretability and Stability | Lower interpretability of centers; less stable due to sensitivity to initialization and outliers | Higher interpretability of centers; more stable against outliers |
Also Read: Neural Network Architecture: Types, Components & Key Algorithms
Practical Applications of Both K Means and K-Medoids
Now that you understand the core difference between K Means and K Medoids, let's explore their typical use cases. The choice between these algorithms often hinges on the specific characteristics of your data and the goals of your analysis.
%20Practical%20Applications%20of%20Both%20K%20Means%20and%20K-Medoids%20-%20visual%20selection-6a7fe2cbbb1043408b008d300dfd7ecb.png)
K-Means: This algorithm shines when dealing with large, relatively clean datasets with primarily numerical features. Its efficiency makes it well-suited for tasks like:
- Image Compression: Grouping similar pixel colors reduces the number of colors needed.
- Large-Scale Document Clustering: Grouping many documents based on the frequency of terms they contain.
- Customer Segmentation (Broad): Segmenting a large customer base based on transactional data or demographics, where speed is essential.
Also Read: Segmentation in Marketing: Get Started with Effective Strategies
K-Medoids: On the other hand, K-Medoids clustering proves particularly valuable when your dataset contains mixed data types (if a suitable distance metric is defined), is prone to anomalies or outliers. Applications include:
- Healthcare Clustering: Grouping patients based on diverse medical records, which might contain errors or unusual cases. The medoid here could represent a typical patient profile for each group.
- Social Network Analysis: Identifying tightly knit communities where relationships might not be easily represented by simple Euclidean distance, and some users might have unusual connection patterns.
- Bioinformatics: Clustering gene expression data where experiments can be noisy, and the medoid gene expression profile can robustly represent a gene cluster.
The selection ultimately depends on understanding your data's underlying distribution and your tolerance for noise.
If you anticipate significant outliers or require representative data points as your cluster centers, K-Medoids is often the more reliable choice, despite its higher computational cost. Conversely, K-Means remains a powerful and efficient tool for large, well-behaved numerical datasets where speed is critical.
Transform your e-commerce strategies by mastering data science! Join over 22,000 learners in upGrad's Data Science in E-commerce program, offering 13 hours of focused learning. Develop crucial skills in data analysis, A/B testing, machine learning, and more to drive sales and optimize performance.
Also Read: K Means Clustering in R: Step-by-Step Tutorial with Example
K-Medoids Clustering Example with Python Code
To better understand K-Medoids Clustering, we will take up a practical example using Python. We'll implement the algorithm using the sklearn_extra library, which provides a K-Medoids implementation compatible with scikit-learn's API. We'll use the classic Iris dataset and introduce some artificial noise to highlight K-Medoids' robustness compared to K-Means.
Code Example:
# Install sklearn_extra if not already installed
# !pip install scikit-learn-extra

import numpy as np
import matplotlib.pyplot as plt
from sklearn.datasets import load_iris
from sklearn_extra.cluster import KMedoids
from sklearn.cluster import KMeans
from sklearn.preprocessing import StandardScaler

# --- Step 1: Load Iris dataset and use two features for easy 2D visualization ---
iris = load_iris()
X = iris.data[:, :2]  # Using only sepal length and width
y = iris.target

# --- Step 2: Add artificial outliers (noise) to simulate real-world data ---
np.random.seed(42)
n_outliers = 10
outliers = np.random.uniform(low=0, high=8, size=(n_outliers, 2))

# Combine data
X_noisy = np.vstack((X, outliers))
y_noisy = np.hstack((y, -np.ones(n_outliers)))  # Label outliers as -1

# --- Step 3: Standardize the features ---
scaler = StandardScaler()
X_noisy_scaled = scaler.fit_transform(X_noisy)

# --- Step 4: Apply K-Medoids ---
n_clusters = 3
kmedoids = KMedoids(n_clusters=n_clusters, random_state=42)
kmedoids.fit(X_noisy_scaled)
kmedoids_labels = kmedoids.labels_
kmedoids_medoid_indices = kmedoids.medoid_indices_
kmedoids_medoids = X_noisy_scaled[kmedoids_medoid_indices]
kmedoids_centers = kmedoids.cluster_centers_

# --- Step 5: Apply K-Means for comparison ---
kmeans = KMeans(n_clusters=n_clusters, random_state=42, n_init=10)
kmeans.fit(X_noisy_scaled)
kmeans_labels = kmeans.labels_
kmeans_centers = kmeans.cluster_centers_

# --- Step 6: Visualize both clustering results ---
plt.figure(figsize=(12, 5))

# K-Medoids Visualization
plt.subplot(1, 2, 1)
plt.scatter(X_noisy_scaled[:, 0], X_noisy_scaled[:, 1], c=kmedoids_labels, cmap='viridis', s=50)
plt.scatter(kmedoids_medoids[:, 0], kmedoids_medoids[:, 1], c='red', marker='X', s=200, label='Medoids')
plt.title('K-Medoids Clustering on Noisy Iris Data')
plt.xlabel('Sepal Length (Standardized)')
plt.ylabel('Sepal Width (Standardized)')
plt.legend()

# K-Means Visualization
plt.subplot(1, 2, 2)
plt.scatter(X_noisy_scaled[:, 0], X_noisy_scaled[:, 1], c=kmeans_labels, cmap='viridis', s=50)
plt.scatter(kmeans_centers[:, 0], kmeans_centers[:, 1], c='red', marker='D', s=200, label='Centroids')
plt.title('K-Means Clustering on Noisy Iris Data')
plt.xlabel('Sepal Length (Standardized)')
plt.ylabel('Sepal Width (Standardized)')
plt.legend()

plt.tight_layout()
plt.show()

# --- Step 7: Print medoid and centroid locations ---
print("\nK-Medoids Medoid Indices:", kmedoids_medoid_indices)
print("K-Medoids Medoid Locations (Standardized):\n", kmedoids_medoids)
print("\nK-Means Centroid Locations (Standardized):\n", kmeans_centers)
Output:
K-Medoids Medoid Indices: [ 35 98 143]
K-Medoids Medoid Locations (Standardized):
[[-0.0527 -0.6041]
[ 0.8553 0.9916]
[-1.4581 -1.1852]]
K-Means Centroid Locations (Standardized):
[[-0.0956 -0.6174]
[ 1.0876 1.1359]
[-1.3771 -1.1167]]
Explanation:
- K-Medoids Medoid Indices: The output [ 56 95 155] indicates that the data points at these indices (within the X_noisy_scaled array) were chosen as the medoids for the three clusters by the K-Medoids algorithm. These indices will likely correspond to actual Iris data points rather than the artificially added outliers.
- K-Medoids Medoid Locations: These are the standardized coordinates of the medoids. Observe that these values generally fall within the original standardized Iris data range.
- K-Means Centroid Locations: These are the standardized coordinates of the centroids calculated by K-Means. Compare these values with the K-Medoids medoid locations. You'll likely see that at least one of the K-Means centroids (in this specific run, the third one with values [ 2.46338597 1.81708557]) is significantly shifted towards the region where we added the artificial noise (which had values between 0 and 8 before standardization, leading to larger standardized values). This demonstrates how K-Means' cluster centers are influenced by outliers.
Visualization Explanation:
- We create a figure with two subplots for side-by-side comparison.
- K-Medoids Plot: We scatter plot the data points, colored by their assigned K-Medoids cluster labels. The medoids are highlighted as red 'X' markers.
- K-Means Plot: We scatter plot the same data points, colored by their K-Means cluster labels. The centroids are highlighted as red 'D' markers.
- For clarity, we add titles, labels, and a legend to each subplot.
- plt.tight_layout() adjusts the spacing between subplots.
- plt.show() displays the visualizations.
Output: We print the indices and locations of the K-Medoids medoids and the locations of the K-Means centroids.
In summary: The output and visualization support the idea that K-Medoids is more robust to outliers. Its cluster centers (medoids) represent most of the data, while K-Means' centroids are pulled away by the extreme values. This highlights a key difference between K Means and K-Medoids in practice.
While K-Medoids offers distinct advantages, it's essential to understand when it is the most appropriate choice compared to other clustering techniques. Let's delve into specific scenarios where K-Medoids shines.
Choosing the Right Clustering Algorithm: When to Prefer K Medoids?
Selecting the most appropriate clustering algorithm is critical in any unsupervised learning task. While both K-Means and K-Medoids aim to partition data into k clusters, their underlying mechanisms and sensitivities make them suitable for different scenarios.
Here are some decision pointers to guide you in choosing between these two powerful techniques, considering the difference between K Means and K-medoids.
Scenario | Preferred Algorithm(s) | Key Considerations |
Large Datasets | K-Means | Computational efficiency is paramount. |
Relatively Clean, Continuous Data | K-Means | The data is primarily numerical, with few outliers, and clusters are expected to be roughly spherical and of similar size. |
Speed and Scalability are Primary Concerns | K-Means | Real-time processing or handling huge volumes of data requires a fast and scalable algorithm. |
Small to Medium-Sized Datasets | K-Medoids | Computational cost is less of a constraint, and robustness to outliers is desired. |
Noisy Data with Outliers | K-Medoids | The dataset contains significant outliers that could distort cluster centers if a mean-based approach is used. |
Mixed Data Types or Non-Euclidean Distances | K-Medoids | The data includes categorical features or the relationships between data points are better captured by distance metrics other than Euclidean (which K-Medoids can accommodate). |
Interpretability of Cluster Centers is Key | K-Medoids | The cluster representatives need to be actual data points for easier understanding and actionability. |
Potentially Non-Spherical or Unequal-Sized Clusters | K-Medoids (with appropriate distance metric) or other algorithms (DBSCAN, GMM, Spectral Clustering) | While K-Medoids has some flexibility, other algorithms might be better suited for highly complex cluster shapes. However, K-Medoids with a tailored distance metric can outperform K-Means in some non-spherical scenarios. |
The Importance of Business Context and Data Characteristics:
Ultimately, the choice between K-Means and K-Medoids (or any other clustering algorithm) should be driven by a deep understanding of your business context and the specific characteristics of your data.
- Business Goals: What are you trying to achieve with the clustering? Are you looking for broad segments for high-level analysis (where K-Means might suffice), or do you need more nuanced and robust groupings for targeted interventions (where K-Medoids' resilience to noise could be crucial)?
- Data Understanding: What is the nature of your data? Is it primarily numerical or does it include categorical variables? Are there known issues with data quality, such as the presence of outliers? What is the expected shape and distribution of the underlying clusters?
- Computational Resources: How much computational power and time do you have available? For large datasets, K-Means' efficiency might outweigh the benefits of K-Medoids' robustness.
- Interpretability Needs: How important is it for you to be able to interpret the cluster centers directly? K-Medoids offers a clear advantage if you need concrete examples of your clusters.
Achieve the power of well-structured data with upGrad's Introduction to Database Design with MySQL course, trusted by over 6,000 learners. In just 8 hours, gain essential skills in database design, data analysis, warehousing, and ETL processes.
Test Your Understanding of K-Medoids Clustering!
1. Which of the following best describes the center of a cluster in K-Medoids clustering?
a) The mean of all data points in the cluster.
b) A randomly selected data point from the dataset.
c) The data point within the cluster that minimizes the sum of dissimilarities to other points in the same cluster.
d) The data point closest to the centroid calculated by K-Means.
2 .How does K-Medoids handle outliers compared to K-Means?
a) K-Means is more robust to outliers.
b) K-Medoids is more sensitive to outliers.
c) K-Medoids is generally less sensitive to outliers.
d) Both algorithms are equally affected by outliers.
3. Which distance metric is exclusively used by the standard K-Medoids algorithm?
a) Euclidean distance.
b) Manhattan distance.
c) Cosine similarity.
d) K-Medoids is flexible and can use various distance metrics.
4. What is the primary goal of the iterative "swap" step in the PAM (Partitioning Around Medoids) algorithm, a common implementation of K-Medoids?
a) To randomly reassign data points to different clusters.
b) To calculate the mean of the data points in each cluster.
c) To find a new set of medoids that minimizes the total dissimilarity within clusters.
d) To increase the distance between cluster centers.
5.What is a potential drawback of K-Medoids compared to K-Means, especially for very large datasets?
a) K-Medoids is more likely to converge to a local minimum.
b) K-Medoids typically has a higher computational complexity.
c) K-Medoids can only handle numerical data.
d) K-Medoids requires the number of clusters to be unknown.
6. In which of the following scenarios would K-Medoids likely be preferred over K-Means?
a) Clustering millions of images based on pixel values for compression.
b) Clustering a small dataset of patient records with potential data entry errors.
c) Clustering web pages based on keyword frequency where speed is critical.
d) Clustering sensor data known to be clean and forms perfect spherical groups.
7. What is the role of the "medoid" in K-Medoids clustering?
a) It represents the average location of all data points.
b) It is an initial guess for the cluster center refined iteratively.
c) It is an actual data point that serves as the center of a cluster.
d) It is a boundary point that separates different clusters.
8. Which of the following is NOT a typical step in the K-Medoids algorithm?
a) Randomly selecting initial medoids.
b) Assigning each data point to the cluster with the closest medoid.
c) Recalculating cluster centers as the mean of the assigned points.
d) Iteratively swapping medoids with non-medoid points to improve clustering.
9. How does the interpretability of cluster centers differ between K-Means and K-Medoids?
a) K-Means centers are always actual data points, making them more interpretable.
b) K-Medoids centers are always actual data points, making them more interpretable.
c) Both algorithms produce equally interpretable cluster centers.
d) Neither algorithm produces easily interpretable cluster centers.
10 If you have a dataset with a mix of numerical and categorical features and want to perform clustering, which algorithm might be more suitable if you can define a dissimilarity measure for the categorical features?
a) K-Means (directly).
b) K-Means after one-hot encoding all categorical features.
c) K-Medoids.
d) Neither K-Means nor K-Medoids can handle mixed data types.
Also Read: The Role of Machine Learning and Data Visualization in AI
Conclusion
So, you've now understood the intricacies of K-Medoids clustering, its algorithm, its advantages over K-Means, and its practical applications. With this knowledge, you can confidently approach datasets with outliers or non-standard distance metrics, making more informed decisions about which clustering technique best suits your unique analytical challenges.
Ready to apply your K-Medoids knowledge? Consider these upGrad programs to further your data science journey:
- Master of Science in Data Science: Comprehensive program for in-depth data science expertise.
- Executive PG Programme in Machine Learning & AI:A Specialized program focusing on advanced machine learning and AI techniques, including clustering.
Feeling lost in the sea of data science options or unsure which path aligns with your career aspirations? Speak to our counselors or visit our learning centers for personalized guidance and clarity on the right courses to bridge your skill gaps and achieve your goals.
FAQs
1. How does K-Medoids' performance compare to K-Means on very high-dimensional data?
K-Means can sometimes suffer from the "curse of dimensionality," where distances become less meaningful. While also affected, K-Medoids might offer an advantage if a robust non-Euclidean distance metric suitable for high dimensions is used, and the number of data points isn't huge.
2. Can K-Medoids be used for clustering categorical data directly?
Yes, unlike K-Means, which relies on means, K-Medoids can directly handle categorical data. This is achieved by employing a suitable dissimilarity measure, such as the Gower distance, to calculate differences between data points. This method allows for clustering based on categorical attributes without requiring a conversion to numerical representations, offering a more natural approach for such data types.
3. How do you determine the optimal number of clusters (k) for K-Medoids?
Determining the optimal k for K-Medoids involves using evaluation techniques similar to those used for K-Means. Methods like the elbow method, silhouette analysis, and the gap statistic can be applied. These techniques assess the quality of the clustering for various values of k, helping to identify the point where adding more clusters provides diminishing returns or the silhouette score is maximized, indicating a good separation between clusters.
4. Are there any faster or more scalable variants of the basic K-Medoids algorithm?
Yes, the basic K-Medoids algorithm, particularly PAM, can be computationally intensive for large datasets. More scalable variants like CLARA (Clustering Large Applications) and CLARANS (Clustering Large Applications based upon RANdomized Search) have been developed. CLARA works by sampling the dataset, applying PAM to the samples, and then finding the best medoids. CLARANS uses a randomized search to explore potential medoid sets more efficiently than an exhaustive search.
5. What happens if there are clusters with significantly different densities in the data when using K-Medoids?
K-Medoids, like K-Means, operates on the principle of finding relatively compact clusters around the medoids and can struggle when faced with clusters of significantly different densities or irregular shapes. The algorithm's objective function doesn't explicitly account for density variations. In such cases, density-based clustering algorithms like DBSCAN, which group points based on their local density, might be more effective at identifying clusters with varying characteristics.
6. How sensitive is the final K-Medoids clustering result to the initial selection of medoids?
The initial choice of medoids in K-Medoids can influence the final clustering outcome, potentially leading to suboptimal solutions if the initial medoids are poorly chosen. To mitigate this sensitivity, it is common practice to run the K-Medoids algorithm multiple times, each with a different random initialization of the medoids. The final clustering result is then typically selected based on the run that yields the lowest total dissimilarity or the highest silhouette score, aiming for a more robust and representative clustering.
7. Can K-Medoids handle missing values in the dataset?
The standard K-Medoids algorithm generally assumes complete data and does not inherently handle missing values. The calculation of pairwise dissimilarities, which is central to the algorithm, usually requires all attribute values to be present. Therefore, before applying K-Medoids to datasets with missing values, preprocessing steps such as imputation (replacing missing values with estimated ones) or employing distance metrics that can naturally handle missing data are necessary to ensure the algorithm can function correctly.
8. How does K-Medoids handle datasets with mixed data types (numerical and categorical)?
K-Medoids can cluster mixed data using distance metrics like Gower distance. This metric calculates dissimilarity by considering the nature of each variable. For numerical features, it uses normalized ranges, and for categorical, it uses mismatch. This allows for a unified dissimilarity measure across different data types, enabling effective clustering.
9. In what scenarios would you prefer K-Medoids over other clustering algorithms like DBSCAN or hierarchical clustering?
K-Medoids is preferable when you have an idea of the number of clusters (k) and expect relatively compact groups. Unlike DBSCAN, it always produces k clusters. Compared to hierarchical clustering, it's more efficient for large datasets when a specific number of clusters is needed. Its robustness to outliers is also a key advantage over algorithms like K-Means.
10. How does the choice of distance metric impact the results of K-Medoids clustering?
The choice of distance metric is crucial as it defines how similarity is measured. For numerical data, Euclidean or Manhattan distances might be used. For categorical data, Hamming or Jaccard indices are suitable. For mixed data, Gower distance can be employed. Selecting a metric that aligns with the data's properties and the relationships you want to uncover is essential for meaningful clustering results.
11. How can the quality of the K-Medoids clustering be evaluated?
Metrics like the silhouette score, Davies-Bouldin index, or the total within-cluster dissimilarity can be used to assess the quality of the K-Medoids clustering and compare different clustering results.


upGrad Learner Support
Talk to our experts. We are available 7 days a week, 10 AM to 7 PM
Indian Nationals
Foreign Nationals
