Ordinal Data: Definition, Characteristics, Examples and How to Analyze It
By Sriram
Updated on Jul 15, 2026 | 11 min read | 4.5K+ views
Share:

All courses
Certifications
More
By Sriram
Updated on Jul 15, 2026 | 11 min read | 4.5K+ views
Share:
Table of Contents
Key Highlights
This blog explains what ordinal data is, how to identify it, where it's used, and how to analyze it correctly. You'll also explore practical ordinal data examples and understand how it differs from other measurement scales.
Understanding ordinal data is the first step toward better data analysis. Build practical skills in Machine Learning with upGrad's industry-focused programs and gain hands-on experience with real-world datasets.
Popular AI Programs
Ordinal data is a type of categorical data where values follow a meaningful order or ranking. The categories have a clear sequence, but the difference between consecutive categories isn't equal or measurable. It is commonly used to represent rankings, preferences, satisfaction levels, and performance ratings.
For example, when rating a restaurant as Poor, Fair, Good, Very Good, or Excellent, you know the order of the responses, but you can't determine the exact difference between each category.
Example of Ordinal Data :
Customer Feedback |
Order Exists? |
Equal Intervals? |
| Poor | ✓ |
✗ |
| Fair | ✓ |
✗ |
| Good | ✓ |
✗ |
| Very Good | ✓ |
✗ |
| Excellent | ✓ |
✗ |
Choosing the correct data type affects every step of analysis. If ordinal values are treated as regular numbers, the results may not reflect reality.
You'll commonly find ordinal data in:
Researchers often rely on ordinal scales because they're easy for participants to understand while still providing structured information.
Also Read: How to Learn Machine Learning - Step by Step
The defining feature of ordinal data is that it represents categories in a meaningful order without measuring the exact difference between them. Understanding these characteristics makes it easier to identify ordinal data and distinguish it from other measurement scales.
Characteristic |
Explanation |
| Natural order | Categories follow a logical ranking from low to high or vice versa. |
| Unequal intervals | The difference between categories isn't equal or measurable. |
| Rank, not quantity | Values indicate position rather than exact numerical measurements. |
| Mutually exclusive categories | Each observation belongs to only one category. |
| Common in surveys | Frequently used for ratings, rankings, satisfaction levels, and feedback. |
Read more: Everything You Should Know About Unsupervised Learning
Not all data is measured the same way. Before analyzing any dataset, it's important to understand its measurement scale. Statistics groups data into four levels of measurement, each with different properties and analytical methods.
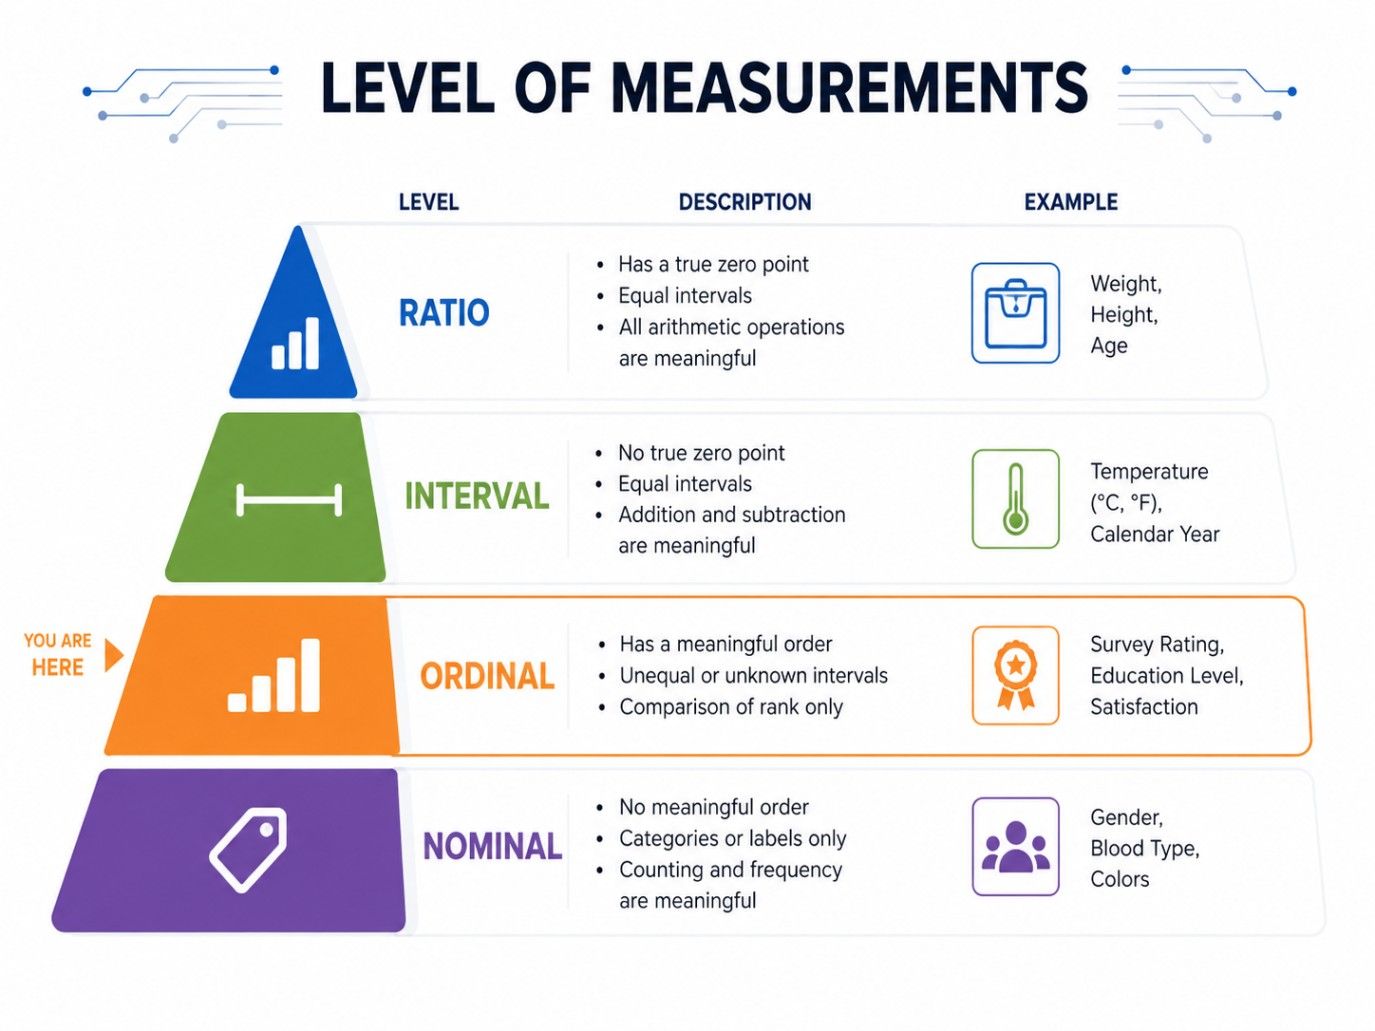
Ordinal data sits between nominal and interval data. It introduces ranking while still lacking equal spacing between categories.
Understanding these four scales makes it much easier to identify the right statistical approach and avoid common errors.
Also Read: Data Cleaning Techniques
Free Courses
Many surveys use Likert scales to measure opinions, attitudes, and satisfaction levels. Because each response is assigned a number, it's common to assume the data is numerical. However, a single Likert scale question produces ordinal data because the responses have a clear order, but the intervals between them aren't equal.
A Likert scale measures how strongly a person agrees or disagrees with a statement using a set of ordered response options.
For example:
Response |
Code |
| Strongly Disagree | 1 |
| Disagree | 2 |
| Neutral | 3 |
| Agree | 4 |
| Strongly Agree | 5 |
The numerical codes simply preserve the order of the responses. They don't indicate that the difference between Agree and Strongly Agree is the same as the difference between Neutral and Agree. Since the spacing between categories isn't measurable, an individual Likert response is classified as ordinal data.
A Likert scale has all the key characteristics of ordinal data:
For these reasons, a single Likert item belongs to the ordinal scale.
Treat Likert responses as ordinal data when:
Choosing statistical methods designed for ordinal data helps produce more accurate results.
One of the biggest misconceptions is that assigning numbers automatically turns the responses into numerical data.That's not true.
The values 1, 2, 3, 4, and 5 are simply codes that maintain the order of the categories. They don't represent measurable distances between responses.
Also read : What is Perceptron in Machine Learning? Beginners Guide
AI Courses to upskill
Explore Artificial Intelligence Courses for Career Progression
Collecting ordinal data isn't difficult, but designing the right categories takes careful thought. Poorly designed response options can confuse participants and reduce the quality of your findings.
Most ordinal datasets come from structured questionnaires, ratings, or expert evaluations.
Common Methods for Collecting Ordinal Data:
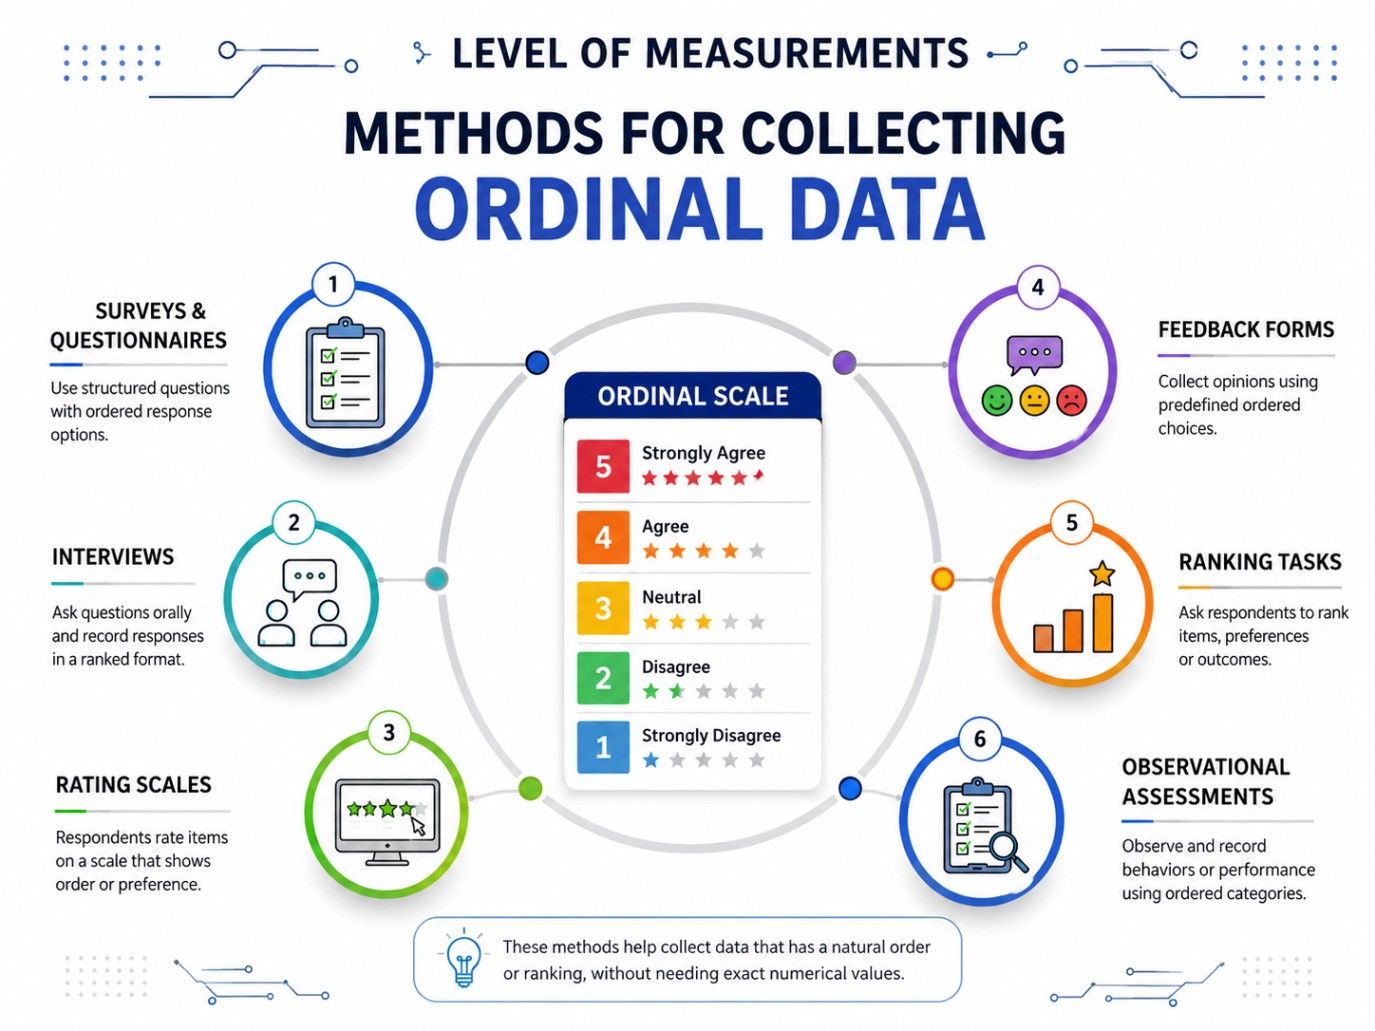
Simple improvements can make a survey much more reliable.
Keep these practices in mind.
Even small wording changes can influence how participants respond.
Learning ordinal data is a key step in preparing high-quality data for machine learning. Take the next step with upGrad's Ex. Diploma in Machine Learning & AI with MLOps, Gen AI & Agentic AI , and build practical skills in Python, machine learning, MLOps, Generative AI, and real-world AI applications.
Before analyzing a dataset, confirm that it actually belongs to the ordinal scale. Use the checklist below to identify whether your data is ordinal.
Ordinal Data Identification Checklist :
Question |
If Yes |
What It Means |
| Do the categories have a meaningful order? | ✓ | The data may be ordinal. |
| Does one category rank higher or lower than another? | ✓ | The values represent rankings. |
| Are the intervals between categories unequal or unknown? | ✓ | The data isn't measured on an equal scale. |
| Do the values represent labels rather than exact quantities? | ✓ | The numbers indicate position, not measurement. |
If your answer is "Yes" to all four questions, you're most likely working with ordinal data.
Simple Rule :
Ask Yourself |
Data Type |
| Do the values represent rank? | Ordinal Data |
| Do the values represent quantity? | Interval or Ratio Data |
| Do the values simply identify categories? | Nominal Data |
This quick checklist helps you identify ordinal data before choosing the appropriate statistical methods
Also read : 15 Key Techniques for Dimensionality Reduction in Machine Learning or visualizations.
Collecting ordinal data is only the first step. To get meaningful insights, you need to analyze it using methods designed for ranked categories rather than numerical measurements. Since the intervals between categories aren't equal, choosing the right statistical techniques is essential.
Start by understanding how the responses are distributed. Descriptive statistics provide an overview of the dataset without making predictions or testing hypotheses.
The most commonly used descriptive measures for ordinal data are:
Example
Satisfaction Level |
Responses |
Percentage |
| Very Dissatisfied | 25 |
5% |
| Dissatisfied | 60 |
12% |
| Neutral | 90 |
18% |
| Satisfied | 210 |
42% |
| Very Satisfied | 115 |
23% |
Because ordinal categories don't have equal intervals, the mean is usually not appropriate. Instead, use the median or mode.
Measure |
Suitable for Ordinal Data? |
Purpose |
| Mean | No | Assumes equal intervals between values |
| Median | Yes | Finds the middle-ranked category |
| Mode | Yes | Identifies the most frequent category |
Example
Student grades: A, A, B, B, B, C, C
If you're comparing groups or studying relationships, use non-parametric statistical tests. These tests are designed for ranked data and don't assume equal spacing between categories.
Statistical Test |
When to Use |
| Mann-Whitney U Test | Compare two independent groups |
| Wilcoxon Signed-Rank Test | Compare paired observations |
| Kruskal-Wallis Test | Compare three or more independent groups |
| Spearman Rank Correlation | Measure the relationship between ranked variables |
Presenting ordinal data visually makes patterns easier to understand.
The most suitable visualizations include:
These charts preserve the order of categories while making comparisons simple.
When interpreting ordinal data, focus on the ranking of categories rather than numerical differences
For example, if most survey respondents selected Satisfied, you can conclude that customer satisfaction is generally positive. However, you can't determine how much more satisfied they are compared to respondents who selected Neutral, because the intervals between categories aren't equal.
Following these five steps helps you analyze ordinal data correctly and draw reliable conclusions without applying statistical methods that aren't appropriate for ranked data.
Good charts make patterns easier to understand.
For ordinal data, consider using:
Avoid scatter plots or line graphs unless there's a clear reason to use them.
A simple decision table can save time.
Your Goal |
Recommended Method |
| Find the most common response | Mode |
| Find the middle response | Median |
| Compare two independent groups | Mann-Whitney U Test |
| Compare several groups | Kruskal-Wallis Test |
| Study ranked relationships | Spearman Correlation |
Once you understand the properties of ordinal data, selecting the right analytical method becomes much easier.
Read more: Everything You Should Know About Unsupervised Learning
Both ordinal data and nominal data are categorical, but there's one key difference. Ordinal data has a meaningful order, while nominal data simply classifies observations into categories without any ranking.
Ordinal Data vs nominal data:
Feature |
Ordinal Data |
Nominal Data |
| Meaning | Ranked categories | Unordered categories |
| Natural Order | Yes | No |
| Equal Intervals | No | No |
| Median Can Be Calculated | Yes | No |
| Mode Can Be Calculated | Yes | Yes |
| Common Examples | Satisfaction ratings, education grades, pain levels | Eye color, blood group, nationality, marital status |
Use Ordinal Data When... |
Use Nominal Data When... |
| Categories have a meaningful ranking. | Categories simply identify different groups. |
| You want to compare order or preference. | You only need to classify observations. |
| Examples include ratings, rankings, and satisfaction levels. | Examples include colors, blood groups, and nationalities. |
A simple rule to remember is this: if the categories can be ranked, you're working with ordinal data. If they can't, the data is nominal.
Also Read: How to Implement Machine Learning Steps: A Complete Guide
Both ordinal data and interval data have values arranged in a meaningful order. The key difference is that interval data has equal spacing between values, while ordinal data only indicates rank.
Ordinal Data vs Interval Data:
Feature |
Ordinal Data |
Interval Data |
| Meaning | Represents ranked categories | Represents ordered numerical values |
| Order | Yes | Yes |
| Equal Intervals | No | Yes |
| True Zero | No | No |
| Mean Calculation | Usually not appropriate | Appropriate |
| Common Statistical Measures | Median, Mode | Mean, Median, Mode |
| Example | Customer satisfaction ratings, education grades | Temperature (°C or °F), IQ scores |
Also read : Data Cleaning in Machine Learning: A Complete Guide
Both ordinal data and ratio data have a meaningful order, but ratio data also has equal intervals and a true zero, making it suitable for all mathematical operations.
Ordinal Data vs Ratio Data :
Feature |
Ordinal Data |
Ratio Data |
| Meaning | Ranked categories | Numerical measurements |
| Natural Order | Yes | Yes |
| Equal Intervals | No | Yes |
| True Zero | No | Yes |
| Arithmetic Operations | Not appropriate | All operations are valid |
| Common Examples | Satisfaction ratings, education grades, pain scales | Height, weight, age, income, distance |
The main difference is that ordinal data ranks categories, while ratio data measures actual quantities. Ratio data supports meaningful mathematical calculations because it has equal intervals and a true zero, whereas ordinal data only indicates the relative order of categories.
Also read : Top Machine Learning Skills to Stand Out in 2026!
The easiest way to understand ordinal data is through real-world examples. You'll find ordinal data examples in surveys, education, healthcare, and customer feedback. In each case, the categories follow a logical order, but the difference between consecutive categories can't be measured precisely.
Example |
Ordered Categories |
Why It's Ordinal |
| Education Grades | A, B, C, D, F | Grades rank academic performance, but the gap between grades isn't equal. |
| Customer Satisfaction Ratings | Very Dissatisfied, Dissatisfied, Neutral, Satisfied, Very Satisfied | Responses follow an ordered scale, but the difference between satisfaction levels isn't measurable. |
| Pain Severity Scale | No Pain, Mild, Moderate, Severe, Extreme | Pain levels indicate increasing severity, but the intervals between categories vary from person to person. |
| Competition Rankings | 1st, 2nd, 3rd | Rankings show the order of finish, not the exact difference in performance. |
| Hotel Star Ratings | 1 Star to 5 Stars | More stars represent higher quality, but the improvement between star ratings isn't necessarily equal. |
Ordinal data is useful for ranking responses and measuring opinions, but it also has analytical limitations. The table below highlights its key strengths and weaknesses.
Advantages |
Limitations |
| Easy to collect through surveys | Unequal intervals between categories |
| Simple to understand | Mean is usually inappropriate |
| Ideal for rankings and ratings | Limited mathematical analysis |
| Useful for opinions and satisfaction | Can't measure exact differences |
| Easy to compare ordered categories | Fewer statistical methods available |
Use ordinal data when you need to rank categories rather than measure exact values. It's commonly used in customer satisfaction surveys, education grading, employee performance reviews, and healthcare assessments where the order of responses matters more than the numerical difference between them.
Ordinal data is widely used whenever information needs to be ranked rather than measured precisely. From customer feedback to healthcare assessments, it helps organizations compare responses in a meaningful order without assuming equal differences between categories.
Industry |
Common Ordinal Data Applications |
| Customer Experience | Satisfaction ratings, service quality, customer feedback |
| Education | Letter grades, class rankings, course evaluations |
| Healthcare | Pain severity scales, recovery status, disease stages |
| Human Resources | Performance ratings, employee evaluations |
| Market Research | Brand preference, purchase intention, product satisfaction |
| Hospitality | Hotel star ratings, guest experience scores |
Mistakes in analyzing ordinal data often occur when ranked categories are treated as numerical values. Avoiding the following errors helps improve the accuracy of your analysis.
Mistake |
Why It Matters |
| Treating categories as equal intervals | The gaps between categories aren't equal, even if they're assigned numbers. |
| Using the mean instead of the median or mode | The mean can produce misleading results for ordinal data. |
| Confusing nominal and ordinal data | Nominal data has no order, while ordinal data follows a ranking. |
| Using the wrong statistical test | Tests designed for interval or ratio data may give inaccurate results. |
| Creating unclear response categories | Ambiguous labels can confuse respondents and reduce data quality. |
Following a few simple practices can improve the quality of your data collection and analysis. These tips help you work with ordinal data more accurately and avoid common mistakes.
Understanding ordinal data helps you classify information correctly and choose the right statistical methods. Unlike numerical measurements, ordinal data represents ranked categories where the order matters, but the distance between categories isn't equal. Recognizing this difference helps you avoid common analytical mistakes.
From customer satisfaction surveys to education grades and healthcare assessments, ordinal data is widely used to organize ranked information. If your data shows a meaningful order without measurable intervals, it's likely ordinal. Identifying it correctly leads to more accurate analysis and better-informed decisions.
Ready to start your journey? Book a free consultation with upGrad today to find the best path for your career.
The ordinal scale is a level of measurement that classifies data into categories with a meaningful order or ranking. However, it does not indicate the exact difference between adjacent categories. Common examples include satisfaction levels, education grades, and competition rankings used in surveys and research.
The four main data types (or levels of measurement) are nominal, ordinal, interval, and ratio. Nominal data classifies without order, ordinal data ranks categories, interval data has equal intervals without a true zero, and ratio data includes both equal intervals and a meaningful zero value.
The difference between nominal and ordinal data lies in whether the categories have a meaningful order. In the ordinal data vs nominal data comparison, nominal data simply classifies observations into groups, while ordinal data ranks those categories. Eye color is nominal, whereas customer satisfaction ratings are ordinal.
Yes. Positions such as 1st, 2nd, and 3rd are classic examples of ordinal data because they indicate rank rather than measurable distance. While they show who finished ahead of whom, they do not reveal how much better one position is than another.
Ordinal numbers indicate position or sequence, such as first, second, and third. Cardinal numbers represent quantity, such as one, two, or three. In statistics, ordinal data focuses on ranking categories, whereas cardinal numbers are typically associated with counting measurable quantities.
Quantitative data is generally divided into interval and ratio data, but many introductory resources also describe four common forms: discrete, continuous, interval, and ratio. Discrete and continuous describe how numbers are collected, while interval and ratio describe how they are measured and analyzed.
Yes, ordinal data supports several statistical techniques that respect ranked categories. Researchers commonly use frequency distributions, median, mode, percentile analysis, Spearman's rank correlation, Mann-Whitney U test, and Kruskal-Wallis test instead of methods that assume equal intervals between values.
An ordinal scale is ideal when respondents need to rank preferences, opinions, or experiences instead of providing exact numerical values. It is widely used in customer satisfaction surveys, employee engagement studies, healthcare assessments, and market research where ordered responses provide meaningful insights.
The difference between nominal and ordinal data is that nominal data classifies observations into categories without any ranking, while ordinal data arranges categories in a meaningful order. In the ordinal data vs nominal data comparison, customer satisfaction ratings are ordinal because they follow a sequence, whereas eye color and blood groups are nominal because they don't have a natural order.
Ordinal data helps organizations measure attitudes, satisfaction, preferences, and performance when exact numerical values are unavailable or unnecessary. Businesses use it to improve customer experience, while researchers rely on it to analyze ranked responses and identify meaningful trends across different population groups.
A variable is ordinal if its categories follow a meaningful sequence, but the distance between adjacent categories cannot be measured precisely. Ask whether the values can be logically ranked and whether equal intervals exist. If only ranking is possible, the variable is ordinal.
730 articles published
Sriram K is a Senior SEO Executive with a B.Tech in Information Technology from Dr. M.G.R. Educational and Research Institute, Chennai. With over a decade of experience in digital marketing, he specia...
Speak with AI & ML expert
By submitting, I accept the T&C and
Privacy Policy
Top Resources
Master's Degree
18 Months
Executive Diploma
12 Months
IIIT Bangalore
Executive Programme in Generative AI & Agentic AI for LeadersIndia’s #1 Tech University
Dual Certification
5 Months