DuPont Analysis: Formula, Components, Example, and Interpretation
By Sriram
Updated on Aug 06, 2026 | 10 min read | 7.08K+ views
Share:

All courses
Certifications
More
By Sriram
Updated on Aug 06, 2026 | 10 min read | 7.08K+ views
Share:
Table of Contents
Key Highlights
Want to master business and financial analysis? Join upGrad's MBA course to learn financial analysis, corporate strategy, and leadership from industry experts.
Popular MBA Programs
DuPont Analysis is a financial performance framework that breaks down a company's Return on Equity (ROE) into key financial ratios. Rather than showing only the final ROE, it explains what drives the return. It evaluates three key factors: profitability, asset efficiency, and financial leverage. This gives investors and analysts a clearer understanding of a company's financial performance.
The method helps answer questions such as:
By examining these factors, DuPont Analysis provides a more detailed understanding of business performance than ROE alone.
Example of DuPont Analysis
If two companies report an ROE of 18%, DuPont Analysis can reveal whether:
Deeper analysis helps investors make more informed decisions.
Investors and analysts use DuPont Analysis to understand what drives a company's Return on Equity (ROE). Instead of treating ROE as a single metric, it breaks it into profitability, asset efficiency, and financial leverage. This helps determine whether returns are driven by strong business performance or increased debt.
Common use cases
Benefit |
How It Helps |
| Better ROE insights | Explains what drives shareholder returns |
| Deeper financial analysis | Separates profitability, efficiency, and leverage |
| Easier company comparison | Enables meaningful peer comparisons |
| Better investment decisions | Distinguishes operational strength from debt-driven returns |
| Performance monitoring | Tracks financial performance over time |
Instead of asking "What is the company's ROE?", investors and analysts use DuPont Analysis to answer a more important question:
"What factors are driving the company's Return on Equity, and are those returns sustainable?"
Makes DuPont Analysis an essential tool for financial statement analysis, equity research, and investment decision-making.
Free Courses
Return on Equity (ROE) is a popular measure of profitability, but it doesn't explain what drives the return. A high ROE may result from strong profit margins, efficient asset use, higher financial leverage, or a combination of these factors.
DuPont Analysis solves this by breaking ROE into smaller financial ratios. Depending on the level of detail required, you can use the 3-step model for a quick overview or the 5-step model for a deeper analysis of taxes, interest expenses, and operating performance.
The traditional DuPont model expresses Return on Equity as the product of three financial ratios:
ROE = Net Profit Margin × Asset Turnover × Equity Multiplier
Each ratio highlights a different aspect of business performance.
Component |
Formula |
What It Measures |
| Net Profit Margin | Net Income ÷ Revenue | Profitability |
| Asset Turnover | Revenue ÷ Average Total Assets | Asset efficiency |
| Equity Multiplier | Average Total Assets ÷ Average Shareholders' Equity | Financial leverage |
How the 3-Step Model Works
Together, these three components explain the source of a company's ROE rather than presenting it as a single number.
While the 3-step DuPont Analysis provides a solid overview of a company's profitability, efficiency, and leverage, it doesn't explain why profit margins change. The 5-step DuPont Analysis addresses this by breaking profitability into three additional components, helping analysts identify whether taxes, interest expenses, or operating performance are influencing ROE.
The 5-step model is commonly used in equity research, corporate finance, and financial statement analysis because it offers a more detailed evaluation of a company's financial performance.
5-Step DuPont Analysis Formula
ROE = Tax Burden × Interest Burden × Operating Margin × Asset Turnover × Equity Multiplier
Each component isolates a different factor affecting Return on Equity.
Component |
Formula |
What It Measures |
| Tax Burden | Net Income ÷ Earnings Before Tax (EBT) | Impact of taxes on profitability |
| Interest Burden | EBT ÷ Earnings Before Interest and Taxes (EBIT) | Effect of interest expenses |
| Operating Margin | EBIT ÷ Revenue | Operating profitability |
| Asset Turnover | Revenue ÷ Average Total Assets | Asset efficiency |
| Equity Multiplier | Average Total Assets ÷ Average Shareholders' Equity | Financial leverage |
Instead of looking at profit margin as a single figure, the model separates it into:
This breakdown helps analysts identify the exact factor responsible for changes in ROE.
Both models aim to explain Return on Equity (ROE), but they differ in the level of detail they provide. The 3-step model offers a quick overview, while the 5-step model dives deeper into profitability by separating the effects of taxes and interest expenses.
Feature |
3-Step DuPont Analysis |
5-Step DuPont Analysis |
| Number of Components | 3 | 5 |
| Complexity | Simple | More detailed |
| Profitability Analysis | Net Profit Margin | Tax Burden, Interest Burden, and Operating Margin |
| Best For | Beginners and quick analysis | Financial analysts and detailed evaluation |
| Key Advantage | Easy to calculate and interpret | Pinpoints the exact drivers of ROE changes |
The 3-step DuPont Analysis is best for a quick overview of ROE and company comparisons, while the 5-step model provides deeper insights by breaking down the impact of taxes, interest, and operating performance. For most analyses, start with the 3-step model and use the 5-step model for detailed evaluation.
MBA Courses to upskill
Explore MBA Courses for Career Progression
O.P.Jindal Global University
MBA (with Career Acceleration Program by upGrad)Become interview ready with Career Services
PSB MBA + IIML Certification
MBA from Paris School of Business with Certification from IIM LucknowEach component of DuPont Analysis contributes to Return on Equity in a different way. Understanding these ratios individually makes it easier to identify a company's strengths and areas for improvement.
Net Profit Margin measures how much profit a company generates from every dollar of revenue after deducting all operating expenses, interest, and taxes.
Formula:
Net Profit Margin = Net Income ÷ Revenue
A higher profit margin generally indicates that the company controls its costs effectively and converts more sales into profit.
Example:
Net Profit Margin = 15%
This means the company retains ₹15 as profit for every ₹100 in sales.
The Asset Turnover Ratio measures how efficiently a company uses its assets to generate revenue.
Formula:
Asset Turnover = Revenue ÷ Average Total Assets
A higher asset turnover indicates better utilization of assets.
Example:
Asset Turnover = 2.0
This means every ₹1 invested in assets generates ₹2 in revenue.
The Equity Multiplier measures the degree of financial leverage a company uses.
Formula:
Equity Multiplier = Average Total Assets ÷ Average Shareholders' Equity
A higher equity multiplier suggests that the company relies more on debt financing. While leverage can increase shareholder returns, excessive debt also raises financial risk.
Example:
Equity Multiplier = 3
This indicates that each ₹1 of equity supports ₹3 of assets, with the remaining assets financed through liabilities.
The Interest Burden Ratio measures the impact of interest expenses on a company's earnings before taxes.
Formula:
Interest Burden = EBT ÷ EBIT
A value close to 1 indicates low interest expenses, while a lower value suggests that debt servicing significantly reduces profits.
Example:
Interest Burden = 0.83
This means 83% of operating earnings remain after paying interest expenses.
The Tax Burden Ratio shows how much profit remains after taxes are paid.
Formula:
Tax Burden = Net Income ÷ EBT
A higher ratio indicates that the company retains a larger share of its pre-tax earnings.
Example:
Tax Burden = 0.75
This means the company keeps 75% of its pre-tax earnings after taxes.
The Operating Margin measures the profitability of a company's core business operations before accounting for interest and taxes.
Formula:
Operating Margin = EBIT ÷ Revenue
It helps analysts evaluate how efficiently the business manages operating costs.
Example:
Operating Margin = 16%
A higher operating margin generally reflects better cost control and stronger operational efficiency.
The following flow illustrates how each component contributes to Return on Equity.
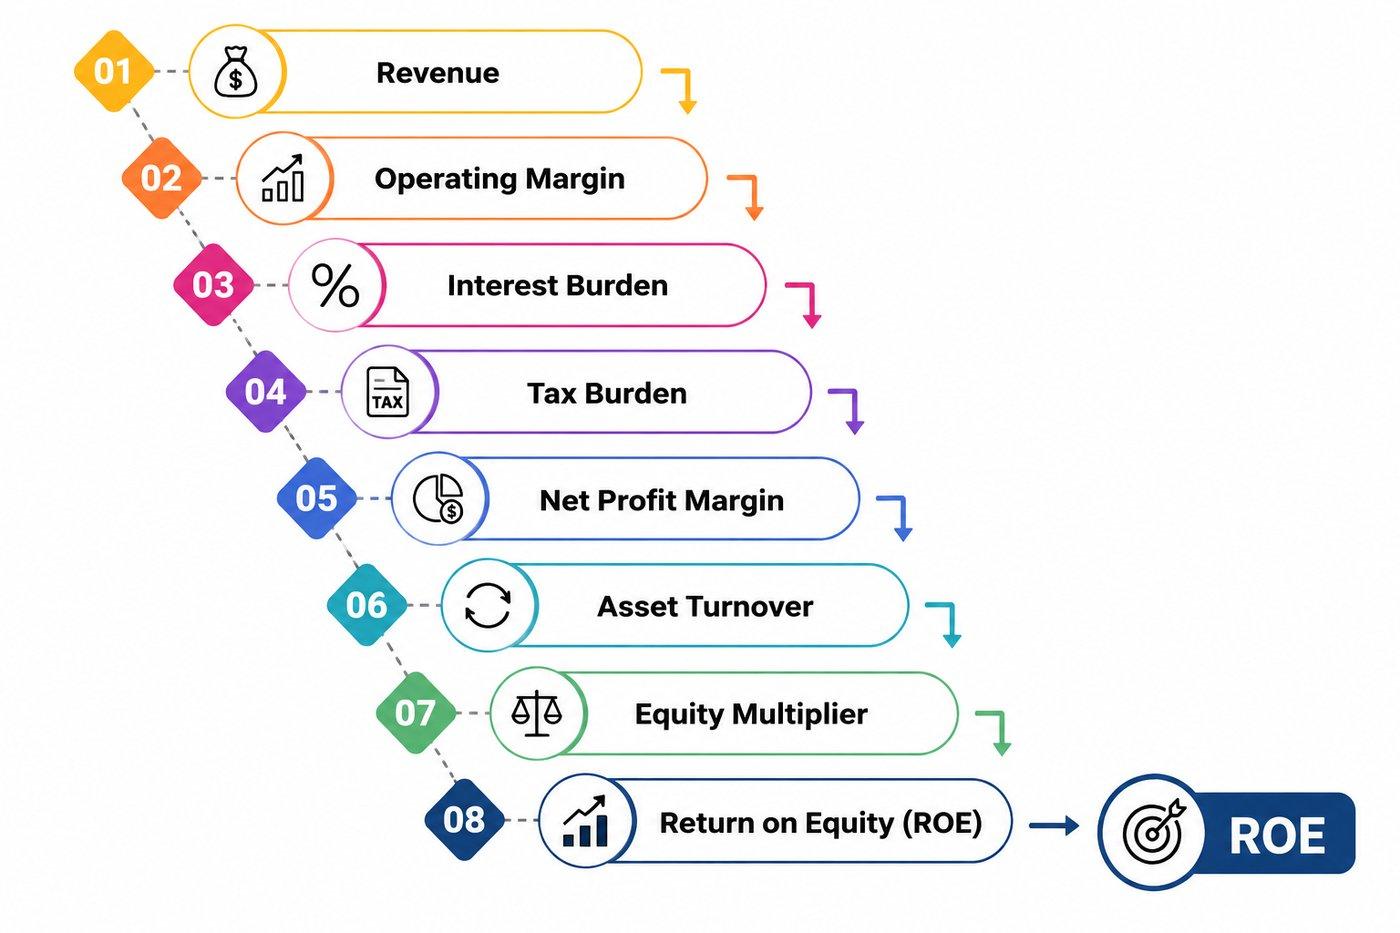
The 3-step model focuses on the final three drivers of ROE, while the 5-step model expands profitability into three separate ratios, making it easier to identify whether operational performance, financing decisions, or taxes are influencing shareholder returns.
Calculating DuPont Analysis is straightforward once you know where to find the required financial data. The values come directly from a company's income statement and balance sheet, making the analysis easy to perform using annual reports, quarterly filings, or financial databases.
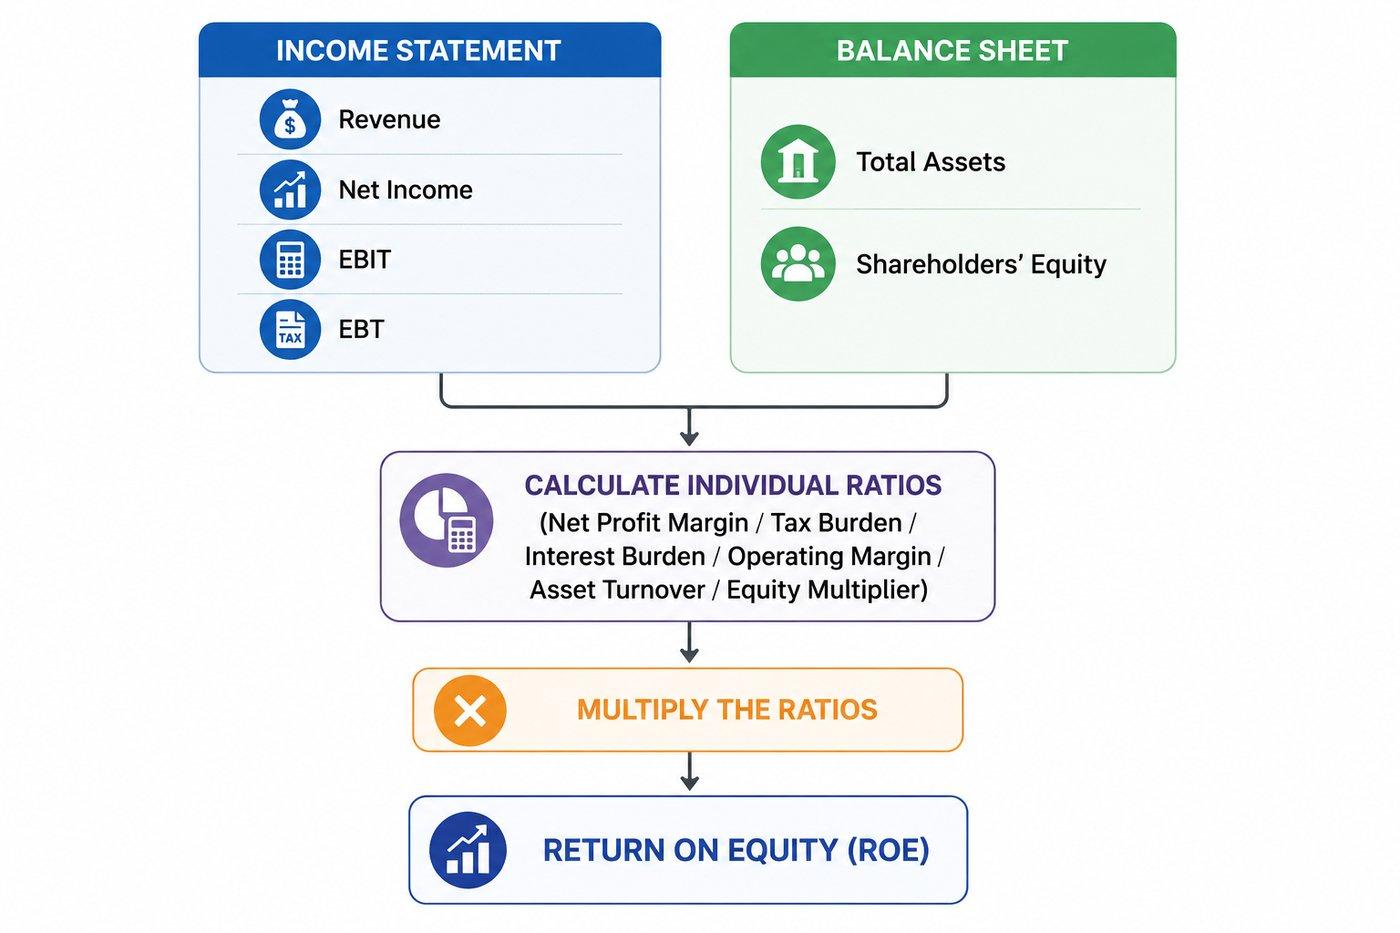
Whether you're using the 3-step or 5-step model, the process follows a logical sequence: collect the financial data, calculate each ratio, and combine them to determine Return on Equity (ROE).
Before calculating DuPont Analysis, gather the following figures from the company's financial statements.
Component |
Financial Statement |
Required Value |
| Revenue | Income Statement | Total Revenue or Net Sales |
| Net Income | Income Statement | Profit After Tax |
| EBIT | Income Statement | Earnings Before Interest and Taxes |
| EBT | Income Statement | Earnings Before Tax |
| Total Assets | Balance Sheet | Average Total Assets (preferred) |
| Shareholders' Equity | Balance Sheet | Average Shareholders' Equity (preferred) |
The calculation differs slightly depending on whether you're using the 3-step or 5-step model.
Steps for the 3-Step DuPont Analysis
Step 1: Calculate Net Profit Margin
Net Profit Margin = Net Income ÷ Revenue
This measures how much profit the company earns from each unit of revenue.
Step 2: Calculate Asset Turnover
Asset Turnover = Revenue ÷ Average Total Assets
This shows how efficiently the company uses its assets to generate sales.
Step 3: Calculate Equity Multiplier
Equity Multiplier = Average Total Assets ÷ Average Shareholders' Equity
This indicates the level of financial leverage used by the company.
Step 4: Calculate Return on Equity
Multiply all three ratios together.
ROE = Net Profit Margin × Asset Turnover × Equity Multiplier
Steps for the 5-Step DuPont Analysis
The advanced model adds three more profitability ratios before calculating ROE.
Although the process involves additional calculations, it provides a much clearer picture of the factors influencing shareholder returns.
The following workflow summarizes the calculation process.
Keep these best practices in mind to ensure reliable results:
By following these steps, you can calculate DuPont Analysis accurately and use it to evaluate a company's financial performance more effectively.
Understanding the formulas is only part of the process. A practical example shows how the individual ratios work together to explain a company's Return on Equity (ROE).
Assume a company reports the following financial data for the year.
Financial Metric |
Value |
| Revenue | ₹800 million |
| Net Income | ₹96 million |
| Average Total Assets | ₹400 million |
| Average Shareholders' Equity | ₹200 million |
Using the 3-step DuPont Analysis, calculate each component.
Step 1: Net Profit Margin
Net Profit Margin = Net Income ÷ Revenue
= 96 ÷ 800 = 12%
This means the company earns ₹12 in profit for every ₹100 of revenue.
Step 2: Asset Turnover
Asset Turnover = Revenue ÷ Average Total Assets
= 800 ÷ 400 = 2.0
The company generates ₹2 in revenue for every ₹1 invested in assets.
Step 3: Equity Multiplier
Equity Multiplier = Average Total Assets ÷ Average Shareholders' Equity
= 400 ÷ 200 = 2.0
This indicates the company uses a balanced mix of equity and debt to finance its assets.
Step 4: Calculate ROE
ROE = 12% × 2.0 × 2.0 = 48%
The company's Return on Equity is 48%.
Interpretation of the Results
At first glance, a 48% ROE appears exceptional. However, DuPont Analysis helps explain where that return comes from.
In this example:
Since all three components contribute positively, the high ROE is supported by strong operational performance rather than debt alone.
The table below summarizes each factor's contribution.
Component |
Value |
Impact on ROE |
| Net Profit Margin | 12% |
Strong profitability |
| Asset Turnover | 2.0 |
Efficient asset utilization |
| Equity Multiplier | 2.0 |
Moderate financial leverage |
This example demonstrates why DuPont Analysis is more insightful than looking at ROE in isolation. Instead of simply knowing that the company achieved a 48% return, you can identify which financial drivers are responsible for that performance.
How to Interpret DuPont Analysis Results
Calculating the ratios is only half the process. The real value of DuPont Analysis lies in interpreting the results to understand why a company's Return on Equity (ROE) is high or low.
Each component highlights a different aspect of financial performance. By analyzing them together, you can determine whether a company is improving through better profitability, efficient asset utilization, or increased financial leverage.
Advantages and Limitations of DuPont Analysis
Like any financial analysis tool, DuPont Analysis has both strengths and limitations. While it offers valuable insights into the drivers of Return on Equity, it should be used alongside other financial metrics rather than in isolation.
Understanding its advantages and limitations helps investors and analysts apply the framework more effectively.
Subscribe to upGrad's Newsletter
Join thousands of learners who receive useful tips
DuPont Analysis remains one of the most widely used financial analysis techniques because it goes beyond a single profitability ratio.
1. Identifies the Drivers of ROE: Instead of showing only the final Return on Equity, DuPont Analysis explains whether the return comes from strong profitability, efficient asset utilization, and higher financial leverage.
2. Supports Better Investment Decisions: Investors can distinguish between companies that generate sustainable profits and those that rely heavily on debt to improve ROE.
3. Simplifies Financial Statement Analysis: By breaking ROE into smaller components, DuPont Analysis helps analysts evaluate financial statements more systematically.
Enables Meaningful Peer Comparisons: When comparing companies within the same industry, the framework highlights differences in profitability, efficiency, and capital structure that may not be apparent from ROE alone.
Tracks Performance Over Time: Monitoring individual components across multiple years helps identify trends in operational efficiency, profitability, and leverage.
Despite its usefulness, DuPont Analysis has several limitations that should be considered before making financial decisions.
1. Ignores Cash Flow: The model focuses on accounting profits rather than cash flow. A company may report strong ROE while experiencing weak operating cash flows.
2. Depends on Accounting Data: Financial statements may be affected by different accounting policies, estimates, or one-time adjustments, which can influence the analysis.
3. Less Effective Across Industries: Different industries have different operating models and capital structures. Comparing companies from unrelated sectors can lead to misleading conclusions.
4. High Leverage Can Distort ROE: A company with significant debt may report an attractive ROE, even if its underlying business performance is weak.
5. Reflects Historical Performance: DuPont Analysis uses historical financial data, so it does not predict future profitability or business performance.
Avoiding the following mistakes will help you interpret the results more accurately.
Different industries operate under different business models, profit margins, and capital structures.
For example, comparing a retail company with a software company using DuPont Analysis may produce misleading conclusions because their asset requirements and operating margins differ significantly.
Best Practice: Compare companies operating within the same industry.
A high ROE isn't always a sign of strong business performance. Sometimes, companies increase ROE simply by taking on more debt, which raises the Equity Multiplier.
If you focus only on the final ROE without examining leverage, you may overlook significant financial risk
Best Practice: Always evaluate the Equity Multiplier alongside Profit Margin and Asset Turnover.
Many beginners calculate Asset Turnover and Equity Multiplier using the balance sheet values at the end of the financial year. This approach can distort the results if the company's assets or equity changed significantly during the year.
Best Practice: Use average total assets and average shareholders' equity whenever possible.
ROE is an important financial metric, but it shouldn't be the only basis for evaluating a company.
A complete financial analysis should also consider:
DuPont Analysis is most effective when combined with other financial metrics rather than used in isolation.
DuPont Analysis is a financial analysis framework that explains why a company generates a particular ROE by breaking it into its underlying drivers: profitability, asset efficiency, and financial leverage.
Whether you use the 3-step model for a quick evaluation or the 5-step model for a deeper analysis, DuPont Analysis provides valuable insights that a standalone ROE cannot. It helps investors identify sustainable profitability.
For a balanced assessment, use DuPont Analysis alongside financial measures such as ROA, ROCE, cash flow, and debt ratios. When interpreted in the right context and compared with industry peers, it becomes a powerful tool for evaluating a company's long-term financial health.
Ready to start your journey? Book a free consultation with upGrad today to find the best path for your career.
Yes. DuPont Analysis remains widely used by investors, equity analysts, financial managers, and corporate finance professionals. Its ability to explain the drivers of Return on Equity makes it valuable for evaluating company performance, comparing competitors, and supporting investment decisions.
DuPont Analysis is used to identify the factors influencing Return on Equity. Instead of reporting only the final ROE, it separates profitability, asset efficiency, and financial leverage, helping analysts understand how a company generates shareholder returns.
DuPont Analysis is also known as the DuPont Model, DuPont Identity, or DuPont Framework. These terms all refer to the same financial analysis method used to decompose Return on Equity into multiple performance ratios.
DuPont Analysis was developed in the early 1900s by finance executives at the DuPont Corporation. The framework was designed to help management evaluate the financial performance of different business divisions more effectively.
You can perform DuPont Analysis in Excel by entering financial statement data such as revenue, net income, total assets, and shareholders' equity into separate cells. Use Excel formulas to calculate each ratio and multiply them to determine Return on Equity. Creating linked formulas also allows you to analyze multiple companies efficiently.
A simple way to remember the 3-step DuPont Analysis is to think of the sequence Profitability → Efficiency → Leverage. These represent the three key drivers of Return on Equity: Net Profit Margin, Asset Turnover, and Equity Multiplier.
It can, but with caution. Banks operate with significantly higher leverage than most businesses, making the Equity Multiplier less meaningful for comparison. Other banking-specific performance metrics should also be considered.
Companies and investors typically perform DuPont Analysis every quarter or financial year. Tracking the ratios over multiple periods helps identify trends in profitability, operational efficiency, and financial leverage.
Yes. DuPont Analysis can highlight financial risks associated with declining profit margins, inefficient asset utilization, or excessive reliance on debt. However, it should be combined with liquidity, solvency, and cash flow analysis for a complete risk assessment.
Yes. Two companies may report the same ROE while achieving it through different combinations of profitability, asset turnover, and financial leverage. DuPont Analysis reveals these differences, providing deeper insight into financial performance.
No. While DuPont Analysis provides valuable insights into Return on Equity, it should not be the sole basis for investment decisions. Investors should also evaluate cash flow, debt levels, valuation metrics, industry conditions, and future growth prospects before making investment choices.
727 articles published
Sriram K is a Senior SEO Executive with a B.Tech in Information Technology from Dr. M.G.R. Educational and Research Institute, Chennai. With over a decade of experience in digital marketing, he specia...
Speak with MBA expert
By submitting, I accept the T&C and
Privacy Policy
From MBA to Dream Job - Explore Our Alumni Success Stories
Top Resources
Master's Degree
13 Months
Master's Degree
12 Months
Master's Degree
15 Months