Financial Modelling in Excel: Build Your First 3-Statement Model (Step-by-Step)
By upGrad
Updated on Nov 10, 2026 | 8 min read | 2.36K+ views
Share:

All courses
Certifications
More
By upGrad
Updated on Nov 10, 2026 | 8 min read | 2.36K+ views
Share:
Table of Contents
Key Highlights
Financial modelling is just one part of a finance career. Learn valuation, budgeting and strategic planning with upGrad’s Online MBA Courses and grow into leadership roles.
Popular MBA Programs
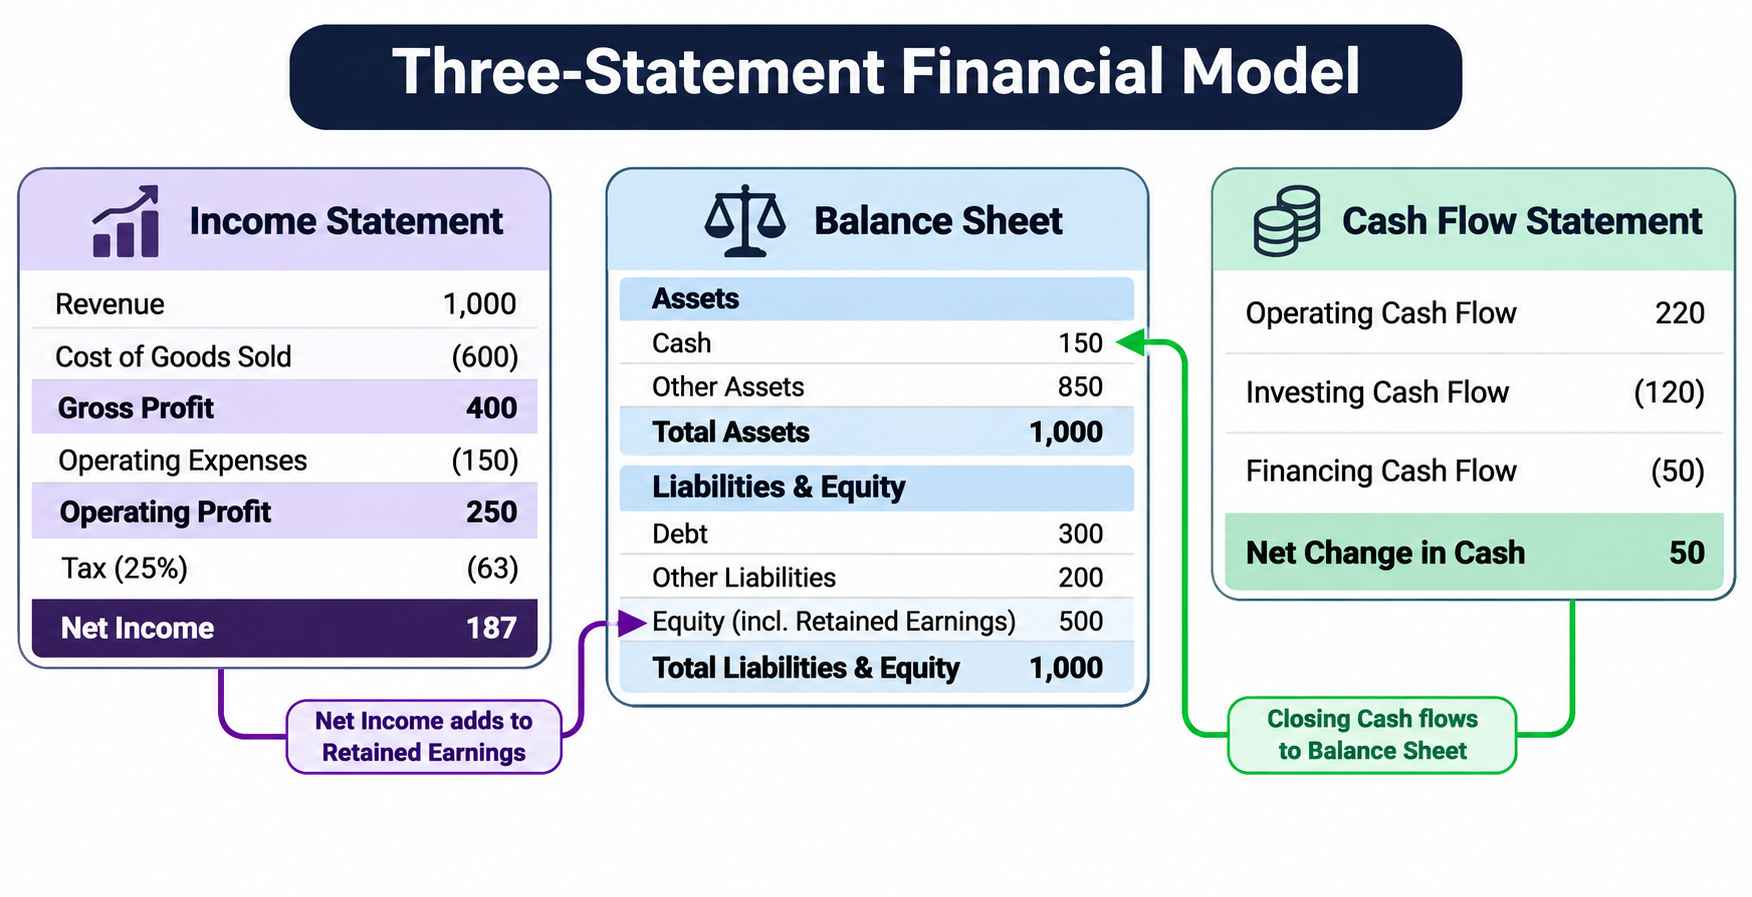
A 3-statement financial model is an Excel file that forecasts a company’s income statement, balance sheet and cash flow statement together. The three-statement models are linked by formulas. So, change any one assumption and you have to update all three.
Each statement answers a different question. The income statement shows whether the company made a profit or not. The balance sheet shows what it owns and owes on a given date. The cash flow statement shows how much cash actually moved.
You need all three because profit is not in cash. A company can book a big sale and still wait months to get paid. On paper it looks healthy, but in the bank account it is not.
There are four links that hold the model together.
Most other models are related to three statement models. A DCF needs its free cash flow forecast. An LBO model uses it to check whether a company can repay acquisition debt. An M&A model joins two of them to see if a deal adds to or dilutes earnings.
Skip it and those models run on shortcuts. That is why it is the first model every analyst learns.
Also read: Top 16 Primary Goal of Financial Management
Free Courses
To build a 3 statement model in financial modelling, you need a few skills, a few early decisions and clean source data. Sort these out first, as it will save your multiple hours later.
Use the company’s annual report. Listed companies also file results with the stock exchange. For Indian companies, check the BSE and NSE websites and the company’s investor relations page.
Get at least three years of history, but five is better. Growth rates, margins and working capital ratios come from it.
Good formatting makes a model easy to read and audit. Follow these rules for 3-statement model practice:
Must read: Financial Statement Analysis: Methods, Types, Ratios, and Examples
MBA Courses to upskill
Explore MBA Courses for Career Progression
O.P.Jindal Global University
MBA (with Career Acceleration Program by upGrad)Become interview ready with Career Services
PSB MBA + IIML Certification
MBA from Paris School of Business with Certification from IIM LucknowBuilding a 3-statement financial model is easier when you follow a fixed order. Each step uses the output of the one before it. Skip ahead and the links break.
Open a new workbook. Make three sheets: Income Statement, Balance Sheet and Cash Flow. Enter three to five years of data from the annual report. Put the oldest year on the left and the latest on the right. Annual reports often show them the other way round, so swap them.
Follow a few rules while entering the data:
Check your work as you go. Sum each section and compare it with the totals in the report. On the balance sheet, assets must equal liabilities plus equity every year. If they don’t, fix it now. A small error here will carry into every forecast year.
Every number that drives the forecast goes on one separate sheet. Call it “Assumptions”. Do not type growth rates or margins inside formulas. Every forecast formula should point to this sheet.
First, calculate the historical ratios from Step 1. Then use them to set the forecast.
Look at the trend before you pick a number. If margins have been stable for four years, keep them stable. If they have moved sharply, find out why. Don’t simply repeat last year’s figure.
Mark every input in blue. Anyone opening the file should see at once which cells are inputs and which are formulas.
Now you can start forecasting. The income statement is the first to build, because the other two statements depend on it.
Go top to bottom, one line at a time.
Read: Top 22 Tools of Financial Statement Analysis
The balance sheet is a snapshot at the end of each year. Most of it is driven by the income statement you just built. Revenue and costs decide how much working capital and how many fixed assets the business needs.
Use the day's assumptions from Step 2. They turn income statement numbers into balance sheet numbers.
Build a small roll-forward schedule: opening PP&E, plus capex, minus depreciation, equals closing PP&E. Capex comes from the Assumptions sheet. Link the depreciation back to the income statement, so both sheets use the same number.
For now, hold debt flat. You will build the full schedule in Step 7. Share capital stays flat too, unless the company issues or buys back shares.
Retained earnings need a formula. Take last year’s balance, add net income and subtract dividends. Dividends are net income × payout ratio.
Leave cash alone. It comes from the cash flow statement, which is the next step.
Want to go beyond building a 3-statement model and lead financial decisions? Explore upGrad’s MBA from Liverpool John Moores University with IIM Udaipur Certification and choose a Finance specialisation covering financial modelling and corporate finance.
The cash flow statement is different from the other two. You don’t forecast it. You build it from the changes in the income statement and balance sheet. It is a reconciliation.
That is why every line must be a link. Never type a number here. A single hardcode will break the balance sheet, and it is hard to spot.
On the asset side, start with last year’s balance and subtract the matching cash flow line. Outflows are negative on the cash flow statement, so subtracting them increases the asset. On the liabilities and equity side, add the cash flow line to last year’s balance.
Apply it line by line:
Link cash last. Everything else on the balance sheet should be done first.
Also read: Asset Liability Management: Meaning, Process, and Role in Banks
So far, debt has been flat and interest has been a placeholder. Now you replace both with a proper schedule. This is also where the model gets harder, so build it slowly.
Use a roll-forward, like PP&E: opening debt, plus new borrowing, minus repayment, equals closing debt. Enter repayments as inputs based on the loan terms. New borrowing is usually zero unless the model needs more funding.
For interest, calculate the historical rate (interest expense ÷ average debt) and set the forecast rate on the Assumptions sheet. Interest expense is rate × debt balance. Link it to the income statement to replace the placeholder.
A good model covers its own funding gaps. Set a minimum cash balance on the Assumptions sheet. If closing cash falls below it, a revolver draws the shortfall. If cash is above it, the surplus builds up on the balance sheet.
Revolver draw = the larger of zero and (minimum cash minus cash before the revolver). Add the draw to financing activities on the cash flow statement, and add the revolver balance to debt on the balance sheet.
Plugs create a loop. Interest depends on debt, debt depends on cash flow, and cash flow depends on net income, which depends on interest. The 3-statement model excel calls this a circular reference and shows a warning.
The simple fix is to calculate interest on the opening debt balance, not the average. The loop disappears, and the small loss in accuracy is fine for a first model.
A model that looks right can still be wrong. Test it before you trust any output in financial modelling.
Two more tests catch what the balance check misses. First, change an assumption, such as revenue growth from 10% to 5%. Every number downstream should move. If something stays frozen, it is hardcoded. Second, check the direction. Raise receivable days and receivables should rise, while operating cash flow should fall. If a number moves the wrong way, a formula is broken.
When the check fails, the cause is usually one of these:
Also read: Capital Budgeting Techniques: Types, Formula, Examples, Advantages, and Comparison
Once the model balances, you can do a 3-statement model test, how it behaves under different assumptions. Two tools do this in financial modelling.
Most first models fail for the same few reasons. None of them are hard to fix once you know what to look for.
Also read: Financial Management: Objectives, Scope, and Importance
Conclusion
Your first 3 statement model will take time. Expect to spend most of it finding why the balance sheet is off. That is normal, it is also where you learn the most. Start with a simple company and annual numbers. Get the balance check to zero before adding anything else. Then add debt, scenarios and detail, one piece at a time.
Once you can build this model, you can build the ones that sit on top of it. A DCF valuation is the natural next step. After that come LBO and M&A models. All of them depend on the foundation you built here.
The best way to learn is to build. Pick a listed company, download its annual report and start from a blank sheet.
Book a one-on-one consultation with upGrad counsellors to get personalized guidance on selecting the best course for your career.
A first model usually takes 8 to 12 hours, including debugging. Most of that time goes into fixing links, not typing formulas. With 3-statement model practice, an experienced analyst can build a similar model in two to three hours.
Almost always, one link is broken. Use Excel’s Trace Precedents on the cash line and follow each input back to its source. Press Ctrl+[ to jump to the source cell. The error usually surfaces within minutes.
Yes, but only the basics. Know that assets equal liabilities plus equity, and that profit differs from cash. Learn the rest as you build. A short accounting course or a few weeks of practice is enough to start.
It means a formula depends on its own result. In models, it usually arises when interest is calculated on average debt. Excel shows a warning when it finds one. Many analysts avoid it entirely to keep models stable.
A 3-statement model forecasts a company’s financials. A DCF takes the cash flows from that forecast and discounts them to present value. The first is the engine. The second is a valuation built on its output.
Three years is the minimum. Five is better, as it can cover a full business cycle and filter out one-off events. Beyond five, old data may no longer reflect how the business operates today.
Five years is standard, especially if the model will feed a DCF. Shorter forecasts are fine for budgets. Longer ones add uncertainty without adding much insight, because assumptions beyond year five are mostly guesses.
Yes. The mechanics are the same. The difficulty is data. Private firms publish less, so you work from management accounts or audited statements. For startups with little history, build revenue from drivers like customers and price.
Start with a simple growth rate. Once comfortable, build revenue from drivers such as units sold times price, or customers times average spend. Driver-based forecasts are easier to defend because each assumption can be checked against real data.
SUM, IF, MAX and MIN cover most of it. Add XLOOKUP or INDEX-MATCH for pulling data across sheets. Learn keyboard shortcuts early, since they speed up every step. You don’t need macros to build a solid first model.
Often. Interviews for banking, equity research and PE ask how the statements link, such as how a ₹10 rise in depreciation flows through all three. Many also set a timed modeling test.
1352 articles published
We are an online education platform providing industry-relevant programs for professionals, designed and delivered in collaboration with world-class faculty and businesses. Merging the latest technolo...
Speak with MBA expert
By submitting, I accept the T&C and
Privacy Policy
From MBA to Dream Job - Explore Our Alumni Success Stories
Top Resources
Master's Degree
13 Months
Master's Degree
12 Months
O.P.Jindal Global University
MBA (with Career Acceleration Program by upGrad)Become interview ready with Career Services
Master's Degree
12 Months