Cross Sectional Study: Meaning, Design, Examples, and How It Works
By upGrad
Updated on Aug 12, 2026 | 148 views
Share:

All courses
Certifications
More
By upGrad
Updated on Aug 12, 2026 | 148 views
Share:
Table of Contents
Key Highlights
Ready to move beyond traditional business learning? A DBA degree can help you develop advanced business expertise, leadership skills, and strategic thinking for the next stage of your career.
A cross sectional study is a research method in which data is collected from a population or a sample at one particular point in time. Researchers use the collected information to describe the population or examine relationships between different variables.
Think of it like taking a photograph.
A photograph shows what a scene looks like at one moment. It does not tell you exactly what happened before the picture was taken or what will happen later. A cross sectional study works in a similar way. It gives researchers a snapshot of a population.
Suppose a researcher wants to understand screen use among college students. They could survey 2,000 students during a particular semester and collect information about:
The researcher can then compare these variables. For instance, students with higher screen time may report shorter sleep duration. This can show an association between the variables.
Also read: Types of Data Collection You Must Know in 2025
The basic process is straightforward, but researchers need to make several decisions before collecting data. A well-designed study starts with a clear research question and ends with careful interpretation of the findings.
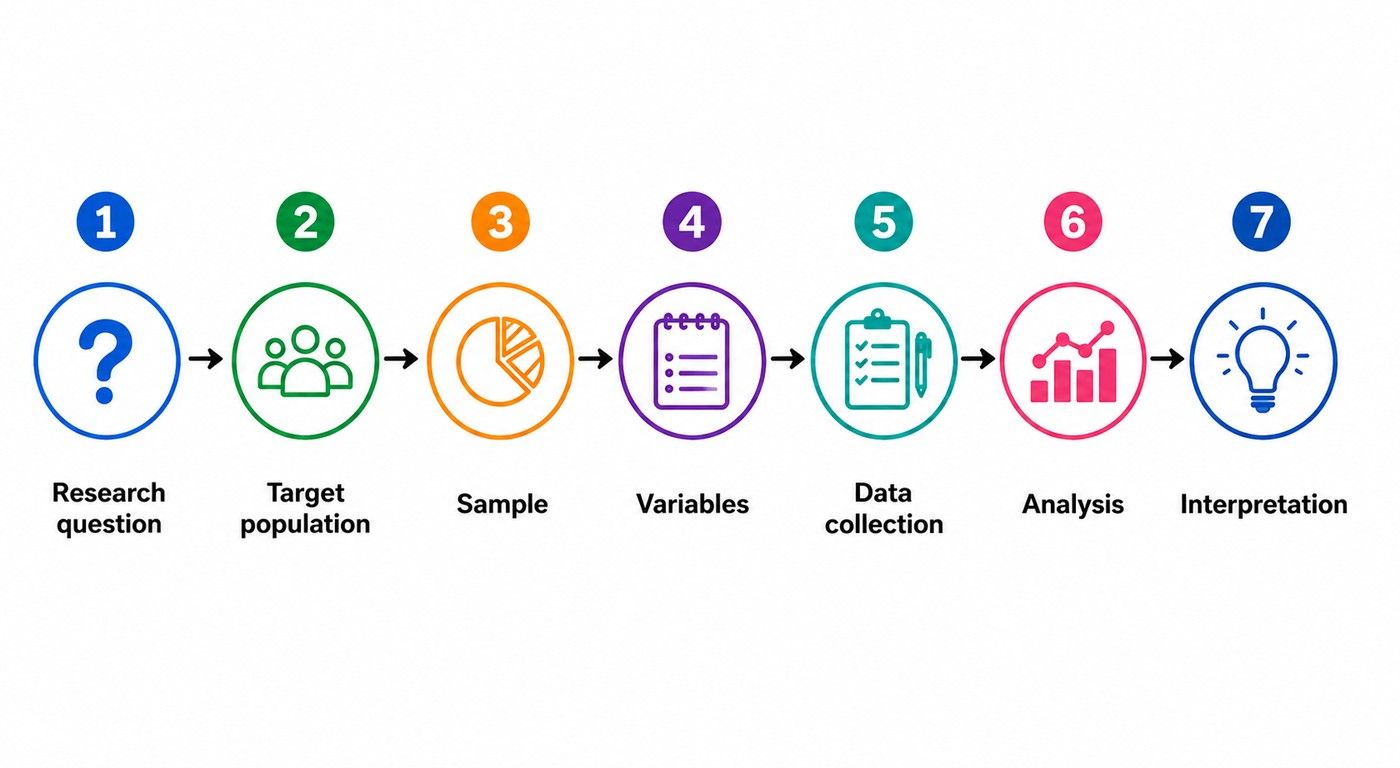
Let's understand each stage.
The researcher first decides what they want to understand about the population. The question should be specific enough to guide the study.
For example:
A vague question can make the rest of the research difficult. A focused question helps determine who should participate, what information should be collected, and which analysis should be used.
The target population is the larger group to which the researchers want their findings to apply. It could be university students, healthcare workers, customers, households, employees, or residents of a particular region.
For example, imagine a study about workplace stress. The target population might be employees working in technology companies in India.
Researchers may not be able to collect data from every employee in that population. Instead, they select a sample that represents the larger group as closely as possible.
Sampling is an important part of the cross sectional study design because the quality of the sample affects how useful the findings are.
Researchers may use methods such as:
The best approach depends on the research question, available resources, population structure, and level of accuracy required.
Researchers then decide what variables they need to measure.
A variable is a characteristic that can take different values. In a student wellbeing study, variables might include age, sleep duration, study hours, physical activity, and stress level.
Variables can generally be divided into different categories.
Researchers should define these variables clearly before collecting information. Otherwise, different participants or researchers may interpret questions differently.
Researchers collect information from participants during a specific period rather than repeatedly following them over time. Data may be collected through:
The exact timing can vary. A study may collect data during one day, one week, or several months if the research is still intended to represent a particular period rather than track changes in the same individuals.
The analysis depends on the research question and the types of variables collected. Researchers may calculate frequencies, percentages, averages, prevalence estimates, or measures of association.
Suppose 200 out of 1,000 surveyed employees report high workplace stress. The researchers can calculate the proportion of employees reporting high stress. They might then examine whether stress is associated with variables such as working hours, job role, or sleep duration.
Statistical tests can help determine whether observed relationships are likely to reflect a real association in the population rather than random variation in the sample.
Researchers need to explain what the results mean without making claims that the study cannot support.
Suppose a study finds that people who exercise less frequently report higher levels of stress. The researcher can report an association between exercise frequency and stress.
That does not necessarily mean that low exercise causes stress. Stress itself could influence exercise habits. Another factor, such as workload, could also affect both. A strong interpretation considers the study's design, sample, measurements, possible biases, and limitations instead of focusing only on statistically significant results.
Also read: A Guide to Nominal, Ordinal, Discrete, and Continuous Types of Data
Not every cross sectional study has the same purpose. Researchers commonly use different approaches depending on whether they want to describe a population, examine associations, or compare information collected during different periods.
A descriptive cross sectional study focuses on describing the characteristics of a population at a particular time.
The researcher may want to know:
The primary goal is description rather than determining why the condition exists. Type of study is especially useful when researchers need a baseline picture of a population before planning further research or public health interventions.
An analytical cross sectional study goes a step further. It examines whether two or more variables are associated with one another.
Imagine researchers survey office employees about physical activity and back pain during the same period. They may compare the prevalence of back pain among employees with different levels of physical activity.
If the groups show different rates, the researchers can investigate whether an association exists.
A repeated cross sectional study involves collecting similar information from a population at multiple points in time. It may sound similar to a longitudinal study, but there is an important difference.
In a repeated cross-sectional design, researchers do not necessarily follow the same individuals. Instead, they may select a new sample from the same population during each period.
Researchers can compare population-level results across the years. They may observe that the percentage of students reporting high stress increased from one year to another.
The focus remains on changes in the population rather than changes within the same individuals.
This distinction becomes particularly useful when comparing a cross sectional study vs longitudinal approach. A longitudinal study follows the same participants or units over time, while a repeated cross sectional study examines samples from the population at different points.
Also read: Data Science Career Roadmap: A Complete Guide for 2025
Cross-sectional research is used in many fields because it can provide a relatively quick picture of a population.
A hospital wants to estimate how many adult patients currently have high blood pressure. Researchers assess 3,000 patients during a defined study period and record their blood pressure, age, weight, and medical history.
The researchers can estimate the prevalence of hypertension and examine whether it is associated with factors such as age or body weight.
The study provides useful information about the population at that time. It does not show how individual patients' blood pressure changed over several years.
A psychologist wants to examine whether sleep duration is associated with anxiety among college students.
The researcher surveys 1,500 students and asks them about their average sleep duration and anxiety symptoms.
The results may show that students reporting fewer hours of sleep also report higher anxiety scores. This finding could provide a basis for future research.
A university surveys students to understand their current use of artificial intelligence tools for academic work.
The questionnaire may collect information about:
The results can help the university understand current student behaviour and attitudes.
A company surveys its employees to understand job satisfaction after introducing a hybrid working policy. Researchers may collect responses about satisfaction, work-life balance, productivity, and preferred working arrangements.
The company can identify patterns across departments or employee groups. For example, employees working remotely more frequently may report different satisfaction levels from those working mainly from the office.
Again, an association does not automatically establish a causal relationship.
A public health organisation conducts a survey to estimate the proportion of adults in a community who use tobacco products.
Researchers collect information about tobacco use, age, occupation, education, and other relevant characteristics.
The findings can help estimate prevalence and identify groups that may need targeted health programmes.
Consider a researcher studying academic stress among 2,000 university students. The researcher collects information on stress, study hours, sleep, workload, and demographics during the same period.
The results may show that students who study longer report higher stress. However, this does not prove that longer study hours cause stress.
Students experiencing stress may also study more because they worry about their academic performance. Other factors could influence both variables.
Take your business expertise to the next level with a Doctor of Business Administration (DBA) from Rushford Business School and prepare for advanced leadership and strategic roles.
A cross sectional study is useful when researchers want to understand what is happening in a population at a specific point in time. It can help describe a population, measure how common a condition is, and identify relationships between variables.
One of the main uses of a cross sectional study is measuring prevalence. It shows how common a disease, behaviour, or condition is within a population at a particular time.
For example, researchers can survey adults in a city to find out what percentage currently have diabetes. These findings can help health organisations understand the scale of a problem and plan resources.
Researchers can use this design to create a current picture of a population. A university, for example, may survey students about their:
An analytical cross sectional study can examine relationships between variables. For example, researchers may study whether physical activity is associated with wellbeing by collecting information about both during the same period.
The analysis may help identify:
Cross-sectional research can reveal patterns that researchers may want to investigate further.
For instance, a survey may find that employees working irregular shifts report higher fatigue. Researchers can use this finding to develop a hypothesis and later test it using a longitudinal study.
Researchers can also work with existing surveys, health records, census data, or other datasets. This can reduce the time and cost of collecting new information.
Before using an existing dataset, researchers should check:
Also read: Key Data Science Skills for Landing Your Dream Job
Although useful, this design is not suitable for every research question. It is less appropriate when researchers need to study changes over time, establish causality, or determine which event occurred first.
Incidence focuses on new cases that develop over a period of time. A single cross-sectional assessment cannot effectively track when new cases occur.
For example, if researchers want to find how many healthy adults develop diabetes over five years, they need to follow participants over time. A cohort or longitudinal study would be more suitable.
A cross sectional study can show the current situation but cannot show how the same individuals change.
For example, surveying employees once can show their current job satisfaction. It cannot show how their satisfaction changed after a new workplace policy. A longitudinal study would be better for this purpose.
Cross-sectional studies are not ideal when the goal is to prove cause and effect. Since exposure and outcome are generally measured at the same time, it can be difficult to determine which came first.
For example, poor sleep may be associated with higher stress, but the study cannot clearly establish whether poor sleep causes stress or stress affects sleep.
Some diseases and health conditions develop or change gradually. A single assessment only shows the condition at one point in time.
Researchers who want to study disease progression may need to track:
Longitudinal research is generally more suitable for this purpose.
A temporal relationship means understanding the order in which events occur. This is important when researchers want to know whether an exposure occurred before an outcome.
For example, if unemployment and depression are measured at the same time, researchers may not know whether unemployment contributed to depression or whether existing difficulties affected employment. Following participants over time can provide clearer evidence about this sequence.
Also read: Types of Data Explained: A Complete Guide for 2025
Conducting a cross sectional study involves more than sending out a questionnaire. Researchers need to plan the population, sampling method, variables, data collection, ethics, and analysis carefully. The following steps provide a practical framework.
Start by deciding who the study will focus on. The target population could include university students, healthcare professionals, customers, employees, or adults in a particular city.
The population should directly match the research question. For example, a study on stress among medical students should focus on medical students rather than unrelated groups.
Researchers should also set clear eligibility criteria to define:
Next, researchers select participants from the target population. Probability sampling is often preferred when findings need to represent a wider population.
Common methods include:
Convenience sampling is easier and less expensive but may increase selection bias if participants do not represent the wider population. The method should therefore match the research objective.
Sample size affects how precise the study results are. A sample that is too small may produce unreliable estimates, while an unnecessarily large sample can waste resources.
The sample size for cross sectional study research depends on factors such as expected prevalence, confidence level, desired precision, and population size.
For estimating a proportion, researchers commonly use:
n = Z² × p × (1 − p) / d²
Where:
Researchers may then adjust the result for factors such as non-response, population size, or sampling design. This process is known as sample size calculation for cross sectional study research.
Each variable should have a clear definition and measurement method.
For example, a study on obesity needs to specify how obesity will be measured. Similarly, a stress study should identify the questionnaire or scoring system used to measure stress.
Clear definitions help ensure that:
Researchers then choose how they will collect the required information.
Depending on the study, they may use:
A small pilot test can also help identify unclear questions, missing response options, or technical problems before the main study begins.
Data should be collected using a consistent process. Participants should receive clear instructions, and researchers should record and store information carefully.
The dataset should also be checked for:
Good data management helps prevent errors from affecting the final findings.
Researchers must protect participants throughout the study. They should explain the study's purpose, what participation involves, and how the collected information will be used.
Depending on the study and research setting, researchers may need informed consent and approval from an ethics committee or institutional review board.
Participant privacy should also be protected, and researchers should collect only the information necessary for the study.
The analysis should directly answer the research question. Researchers may begin with descriptive statistics such as:
If the study examines relationships between variables, researchers may use statistical tests or regression models.
The results should not be judged only by statistical significance. Researchers should also consider the strength of the association, confidence intervals, possible confounding factors, and limitations of the data.
Also read: Top 15 Data Collection Tools in 2025: Features & Benefits
These are the key advantages of using a cross sectional study, particularly when researchers need quick and practical insights about a population.
These are the main disadvantages of cross-sectional studies that researchers should consider before choosing this research design.
Also read: Data Analytics Lifecycle – 8 Stages Explained with Examples!
Even a well-designed study can have errors that affect the accuracy of its findings. Some limitations come from participant selection, while others result from data collection or the timing of measurements.
Selection bias occurs when the participants do not properly represent the population being studied. For example, an online fitness survey may attract people who are already interested in exercise.
This can make the population appear more physically active than it actually is. Researchers can reduce this risk through appropriate sampling methods.
Non-response bias occurs when people who do not participate differ from those who complete the study.
For example, highly dissatisfied employees may be less likely to complete a job satisfaction survey. As a result, the study could underestimate overall dissatisfaction.
Recall bias happens when participants cannot accurately remember past experiences or behaviours.
For example, asking people to report their exercise habits from the previous six months may produce inaccurate answers because some participants may forget activities or estimate their frequency.
Measurement bias occurs when the tools or methods used to collect data produce inaccurate results. It may result from:
Using validated tools and standardised procedures can help reduce measurement bias.
Confounding occurs when another variable affects both the exposure and outcome, making their relationship difficult to interpret.
For example, stress may influence both coffee consumption and sleep. If researchers do not account for stress, they may incorrectly interpret the relationship between coffee consumption and sleep.
Reverse causation occurs when the outcome may actually influence the exposure.
For instance, low physical activity may be associated with depression. However, depression may also reduce a person's motivation to exercise. A cross sectional study may not clearly establish which direction the relationship follows.
Exposure and outcome are usually measured at the same time. Therefore, researchers may not know which occurred first.
This is an important limitation when comparing a cross sectional study vs cohort design. Cohort studies follow participants over time, making it easier to establish the sequence between an exposure and later outcome.
Also read: Data Exploration Basics: A Beginner's Step-by-Step Guide
A cross sectional study provides a snapshot of a population at a specific point in time. It is useful for measuring prevalence, describing population characteristics, exploring associations, and generating research hypotheses.
However, it cannot usually establish causality or show how variables change over time. It is therefore better suited for understanding current conditions than studying incidence, disease progression, or cause-and-effect relationships.
Ready to take the next step in your career? Book a consultation call with upGrad to explore the right learning opportunities for your professional goals.
It is a research method that examines a population at one point in time. Researchers collect information from participants and use it to describe characteristics or identify relationships between variables. It is similar to taking a snapshot of a population rather than following the same people over several years.
It can be quantitative, qualitative, or use a mixed-methods approach, depending on how researchers collect and analyse data. However, many cross-sectional studies are quantitative because they use surveys, measurements, percentages, prevalence estimates, and statistical tests to describe a population or examine associations.
A cross sectional study collects information at one point in time, while a longitudinal study collects information across multiple time points. Longitudinal research is better suited to studying changes and temporal relationships, whereas cross-sectional research is useful for describing the current characteristics of a population.
A cohort study follows a defined group over time to observe outcomes, while a cross sectional study generally assesses participants at one point in time. Cohort research is better suited to studying incidence and temporal relationships. Cross-sectional research is commonly used to estimate prevalence and explore associations.
Usually, no. Because exposure and outcome are generally measured at the same time, researchers may not know which occurred first. Confounding and reverse causation can also affect the findings. A longitudinal or experimental design may provide stronger evidence when establishing causality is the main objective.
A researcher surveys 2,000 university students during one semester to measure stress levels and sleep duration. The researcher can calculate how common high stress is and examine whether stress is associated with sleep. However, the study cannot determine whether poor sleep caused stress or the reverse.
The main limitations include difficulty establishing causality, uncertainty about temporal sequence, susceptibility to selection and non-response bias, recall and measurement problems, and limited ability to study changes over time. The design may also be less useful for rare outcomes or conditions that develop gradually.
It is generally quick, relatively inexpensive, and practical for studying large populations. Researchers can examine multiple variables during one data collection period and estimate prevalence. It can also reveal associations that help researchers develop hypotheses for future longitudinal or experimental research.
Researchers commonly consider the expected prevalence, confidence level, desired margin of error, population size, sampling design, and expected non-response. For estimating a proportion, researchers may use a formula involving the expected prevalence, Z-score, and desired precision before making any necessary adjustments.
Researchers should consider this design when they want to estimate prevalence, describe population characteristics, examine associations, understand current behaviours or opinions, or generate hypotheses. It is particularly useful when information is needed about the current state of a population rather than changes within individuals over time.
Researchers can collect demographic, behavioural, clinical, psychological, social, and economic information. Data may come from questionnaires, interviews, physical measurements, observations, medical records, or existing datasets. The choice depends on the research question and the variables being measured.
987 articles published
We are an online education platform providing industry-relevant programs for professionals, designed and delivered in collaboration with world-class faculty and businesses. Merging the latest technolo...
Speak with DBA expert
By submitting, I accept the T&C and
Privacy Policy