How to Use the BCG Matrix to Make Smarter Business Decisions
By upGrad
Updated on Nov 06, 2026 | 4 min read | 1.35K+ views
Share:

All courses
Certifications
More
By upGrad
Updated on Nov 06, 2026 | 4 min read | 1.35K+ views
Share:
Table of Contents
Key highlights
Explore upGrad’s MBA programmes to develop skills in strategic management, financial planning, marketing, and business leadership. Learn to assess opportunities, manage resources, and drive business growth.
Popular MBA Programs
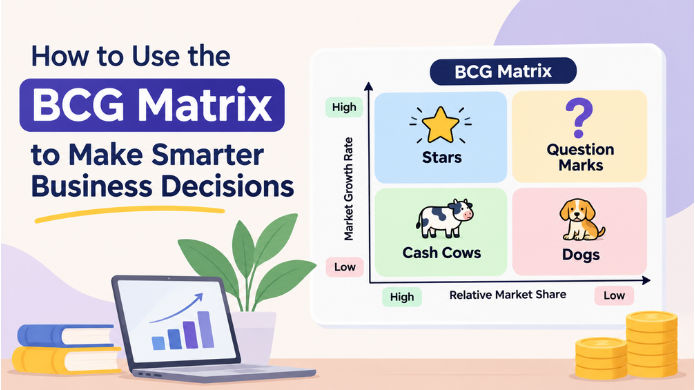
What is BCG matrix in plain terms? It’s a two-by-two grid that sorts products or business units by market growth and relative market share. The BCG matrix in full form is the Boston Consulting Group matrix. The firm introduced it in 1970, and it is also called the growth-share matrix.
Let’s take an example. A snack company sells chips, a protein bar and canned soup. The soup earns steady profit but the market is flat. The protein bar sits in a fast-growing category but holds a small share. Now, all three products have equal budgets. But with BCG grid, you can make different budgets for each product.
The model matters for a few reasons.
The BCG matrix doesn't give you a decision. It tells you which product you should focus on. And which product is not making money.
Explore upGrad’s MBA from Golden Gate University to develop expertise in strategic management, finance, marketing, and decision-making. Learn to assess business opportunities, manage resources, and drive organisational growth.
Free Courses
The BCG Matrix grid has two axes. Market growth rate runs vertically. Relative market share runs horizontally. Each product becomes a circle placed where its two numbers meet, and the circle’s size usually reflects revenue.
Teams commonly draw the line between high and low growth at 10% and the line between high and low share at 1.0. Treat those as starting points. A mature industry like cement may call 5% growth high, while a software category may need 20%.
Market growth rate shows how fast the whole market is expanding, not just your product. It signals how much cash a product will need. Fast markets demand spending on capacity, marketing and distribution to keep up.
If the market grows 15% a year and you grow 5%, you’re losing ground even though sales are rising.
Relative market share compares your sales to those of your largest competitor. A figure above 1.0 means you lead the market. A figure of 0.4 means you sell 40% of what the leader sells.
Why not use plain market share? Because 15% share means very different things in a market where the leader holds 16% and one where the leader holds 60%.
This is what a typical BCG matrix diagram looks like.
High relative share (above 1.0) |
Low relative share (below 1.0) |
|
| High growth | Stars | Question Marks |
| Low growth | Cash Cows | Dogs |
Also read: What is the Product Life Cycle? Stages, Key Strategies and Effective Management Tips
MBA Courses to upskill
Explore MBA Courses for Career Progression
O.P.Jindal Global University
MBA (with Career Acceleration Program by upGrad)Become interview ready with Career Services
PSB MBA + IIML Certification
MBA from Paris School of Business with Certification from IIM LucknowEach quadrant shows a different combination of growth in the market and competitive advantage.
Each quadrant requires a different action.
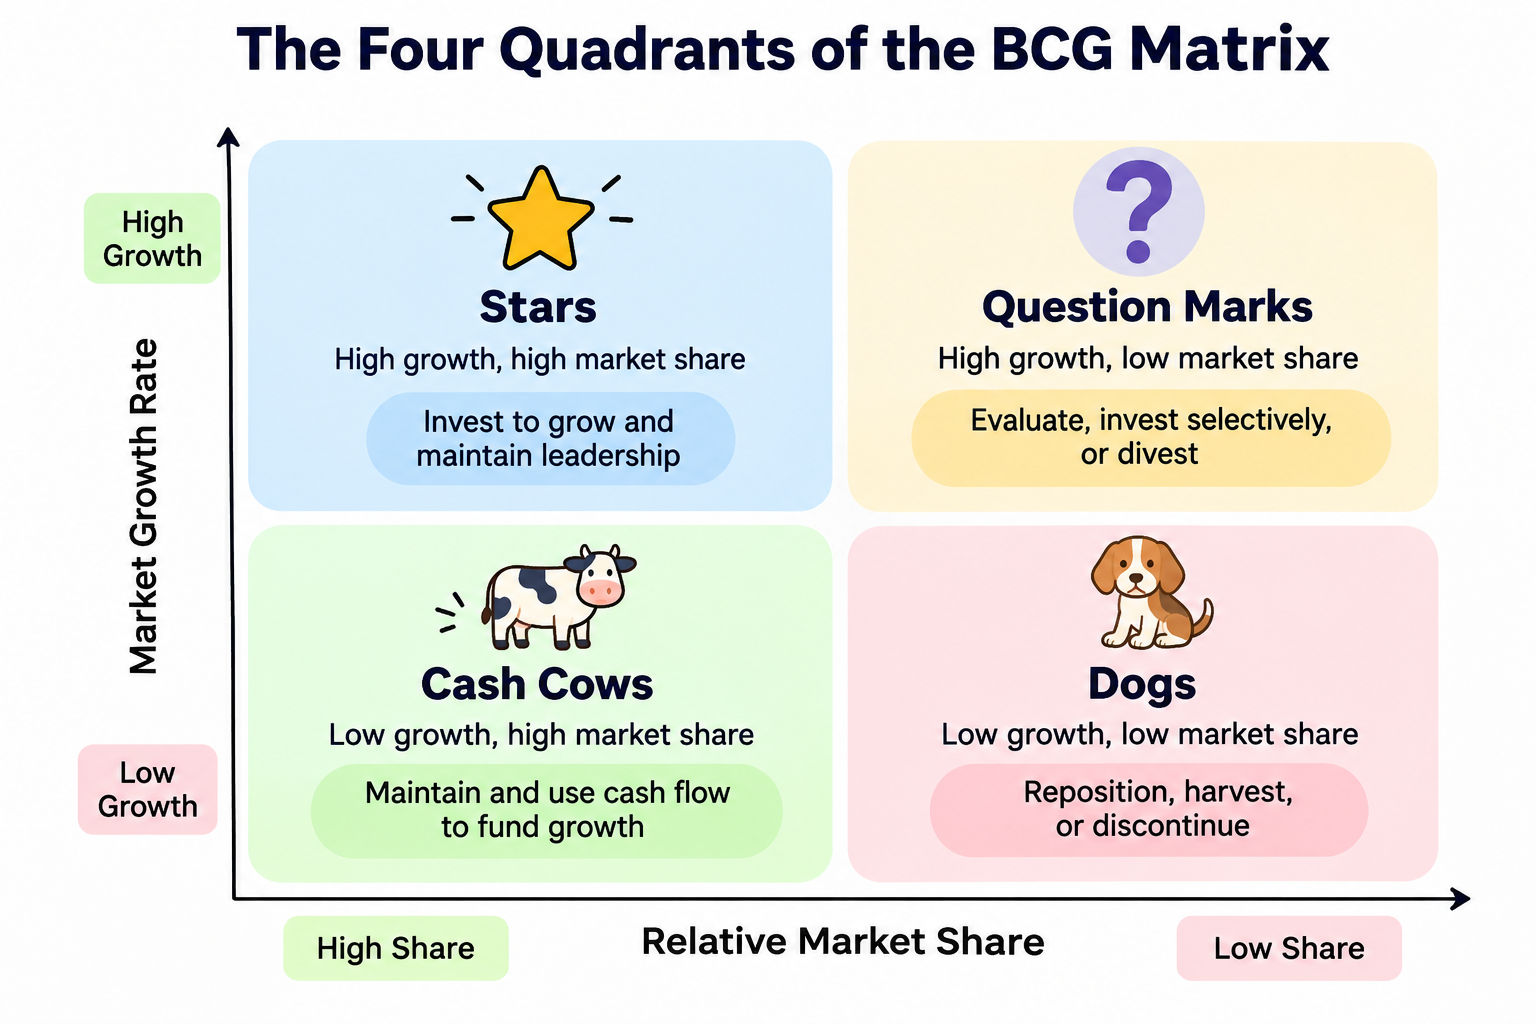
BCG Matrix Diagram
Stars lead fast-growing markets. They earn well but also consume cash, since staying on top means constant spending on capacity, features and promotion.
Invest in them as long as the market keeps growing. The goal is to hold the lead until growth slows. At that point a Star turns into a Cash Cow, which is exactly what you want.
Think of a leading electric scooter model in a city where adoption is climbing 25% a year. You’d keep funding service centres and battery supply, even if profit looks thin for now.
Cash Cows hold a big share of a slow market. They need little investment and produce steady cash. Packaged tea, basic accounting software and tooth powder often fit here.
Protect them, but don’t overspend. Focus on cost efficiency, loyalty and small product refreshes. Their real job is to pay for Stars and Question Marks.
A word of caution. A cow can turn into a problem when a company uses it too much.
Question Marks sit in growing markets but hold a small share. They burn cash and may or may not pay off. This is the hardest quadrant to judge.
Don’t fund them all. Pick the two or three with real evidence of traction, such as rising repeat purchase or strong reviews, and back them hard. Drop or sell the rest.
Half measures fail here. A product with a tiny budget in a fast market rarely climbs. It just slides into the Dog quadrant when growth cools.
Dogs have a low share in slow markets. They rarely earn much and they tie up management attention. Most should be fixed, sold or shut.
Look before you cut, though. Some Dogs cover shared costs, bring in customers who buy other products, or serve a profitable niche. Check three things before deciding.
If the answers are no, no and a lot, you probably keep it for now and stop investing. Otherwise, trim it.
Must read: Strategic Management Process: Steps, Models, and Examples
You don’t need special software. A spreadsheet and reliable sales figures are enough. The harder part is getting trustworthy market data, which we’ll come back to.
Divide your product’s sales by the sales of your largest competitor in the same market.
Relative market share = your product’s sales ÷ largest competitor’s sales
Suppose your product sells ₹40 crore and the top rival sells ₹20 crore. Your relative share is 2.0. If you sell ₹10 crore and the leader sells ₹25 crore, it’s 0.4.
One thing to remember. If you’re the leader, you compare yourself to the second-largest player, not to yourself.
Compare total market sales this year with last year.
Market growth rate = (this year’s market sales − last year’s market sales) ÷ last year’s market sales × 100
If the market was ₹500 crore last year and is ₹560 crore now, growth is 12%. Using a three-year average smooths out one-off spikes.
Here’s how a sample portfolio might read.
Product |
Market growth |
Relative share |
Quadrant |
| Protein bar | 18% | 0.4 | Question Mark |
| Premium chips | 14% | 1.8 | Star |
| Canned soup | 3% | 2.2 | Cash Cow |
| Rice cakes | 2% | 0.3 | Dog |
Do read: Decision Making Models: The Complete Guide for Business and Leadership
Plotting is the easy part but taking decisions is the main point. Here’s how to turn the grid into action.
Start by ranking Stars followed by Question Marks. Choose Question Marks near the 1.0 share curve since they require less effort to move ahead.
Define your criteria for approval before providing funds. For instance, the protein bar should have reached 0.7 relative share in 18 months, or else there is no more funding.
Move surplus cash from mature lines into growth lines. A company might take 20% of the soup profit each year and put it behind the protein bar.
Track it openly. If nobody can say where Cow profit went, it usually disappears into general overhead.
Dogs and failing Question Marks deserve a hard look. Options include a new price point, a narrower target audience, a sale to a smaller player, or a clean shutdown.
Repositioning works when the product is sound but aimed at the wrong buyer. It doesn’t work when the market itself is shrinking.
A healthy portfolio has a mix. Too many Question Marks drain cash. Too many Cows leave you with no future growth. Too many Dogs signal that nobody’s been pruning.
Aim for a balance where Cows fund Stars and a few chosen Question Marks. Review the spread each year and ask whether next year’s Cows are being built today.
Also read: Techniques of Decision-Making: 15+ Tools & Methods for Success
The model is very simple, and that’s both its strength and its weakness. It still misses a few points. Here are the advantages and disadvantages:
Advantages |
Limitations |
| Easy to build and explain | Reduces a product to two variables |
| Links strategy to cash flow | Ignores synergies between products |
| Helps rank competing budget requests | Needs reliable market data |
| Works for products or business units | Market definition changes the result |
The market definition problem is real. Define “snacks” broadly and your protein bar looks tiny. Define it as “protein snacks” and it might lead. Same product, different quadrant.
Share also doesn’t always equal profit. Some low-share players earn excellent margins in niches. And a high-growth label says nothing about whether that growth will last, which is why the grid works best alongside other tools like SWOT or the Ansoff Matrix.
Use it as a starting point for discussion. Don’t treat the quadrant label as a verdict.
Conclusion
The BCG Matrix earns its place because it forces honest answers about where money comes from and where it goes. Plot your products, run the two formulas, and match each quadrant to a clear action. Fund the Stars, protect the Cows, test the Question Marks and review the Dogs.
Then do it every year. Markets can move, and a Star today can be a Cow in two years. Start with your three biggest products and see where they land.
Ready to start your journey? Book a free consultation with upGrad today to find the best path for your career.
The former is the market share in terms of the percentage of total market sales while the latter refers to the comparison of sales to those of your largest rival. If your market share is 20%, for instance, and the leading company has 10% market share, then your relative market share will be 2.0.
Yes, this should be achieved. In case the Question Mark experiences growing sales along with constant investments in marketing, distribution, or the quality of products, it can reach a relative market share of 1.0 in a growing market. Most of such companies do not make it but release funds gradually.
Not necessarily. The Dogs may be used to recoup some of the fixed costs. They may help in promoting other products or provide the loyalty of customers who will also be buying the better products. Consider the cash flows, strategic importance, and costs of exiting the product before discontinuing.
It ranks the products according to the amount of money each requires and the amount of money each generates. The Cash Cows generate money, Stars and promising Question Marks require money, and the Dogs get little money spent on them. It makes the budget issue very concrete like allocating 20 percent of the marketing budget from one product to another.
Yes. A small bakery, a gym that provides various services or a freelance agency providing various packages can create the matrix for each product. Use local or segment data rather than the nationwide data. Trade association estimates, competitor pricing and sales data are sufficient to give an initial understanding of the market.
Marketers utilize BCG Matrix to allocate budget for each product line, select campaigns for scaling up and decide which ones should receive reduced advertising budget. Stars require more attention in terms of brand awareness and distribution. Cash Cows require effort in order to retain customers and be efficient while Question marks need testing.
The BCG Matrix helps assess your current portfolio and gives you an idea of which areas should receive funding. Ansoff Matrix helps plan the ways of growth through new products or markets. In particular, this means either market penetration or diversification strategy. Usually, it starts with the BCG grid followed by Ansoff one, so that you can plan growth for the selected product.
Once a year would be enough for conservative industries. Fast-moving ones, like food delivery or consumer electronics, require updating twice per year or in case of certain events (new competitors, price wars, regulation changes). Growth rate and share changes quicker than you think.
Use substitutes. Information can be provided by trade associations' publications, filings of listed companies, ranking of downloads in the App Store, number of searches and customer surveys. You can also position products as being at the top, middle or bottom without exact figures. Document your assumptions to revise them later on.
Yes, one can consider each service as a product. A digital agency can map SEO services, paid advertisement and web-design depending on the rate of growth of each and their market share as a percentage of agency income from this particular area. Income per service is a substitute of units sold. The difficult part is to identify the markets for each service.
Yes, and that is exactly how it is intended. In the case of a corporation with retail, finance and logistics units, each of which may be plotted according to industry growth and relative market share, capital would be directed appropriately for the group. Business units sharing costs, customers or technology should receive special attention.
1347 articles published
We are an online education platform providing industry-relevant programs for professionals, designed and delivered in collaboration with world-class faculty and businesses. Merging the latest technolo...
Speak with MBA expert
By submitting, I accept the T&C and
Privacy Policy
From MBA to Dream Job - Explore Our Alumni Success Stories
Top Resources
Master's Degree
12 Months
Master's Degree
13 Months
O.P.Jindal Global University
MBA (with Career Acceleration Program by upGrad)Become interview ready with Career Services
Master's Degree
12 Months