Cost of Equity Calculation: Formula, Methods and Examples
By upGrad
Updated on Aug 19, 2026 | 8 min read | 4.46K+ views
Share:

All courses
Certifications
More
By upGrad
Updated on Aug 19, 2026 | 8 min read | 4.46K+ views
Share:
Table of Contents
Key Highlights
Want to go beyond formulas and learn about financial decision-making? Explore our online MBA programs and build the skills to lead in finance, strategy, and beyond.
Popular MBA Programs
Cost of equity is the return a company offers to its stockholders to keep them invested. Think of it as the ‘price' it pays for using shareholders' money, like we interest on using bank money.
Here the difference is that this price isn't fixed like a loan rate. Nobody signs a contract promising shareholders at a certain rate of return. Investors just expect what risk they're taking by owning the stock instead of something safer.
So, companies (and analysts) have to estimate that expected return. That estimate is the cost of equity.
Also read: Complete Guide on Capital Budgeting in Financial Management
Free Courses
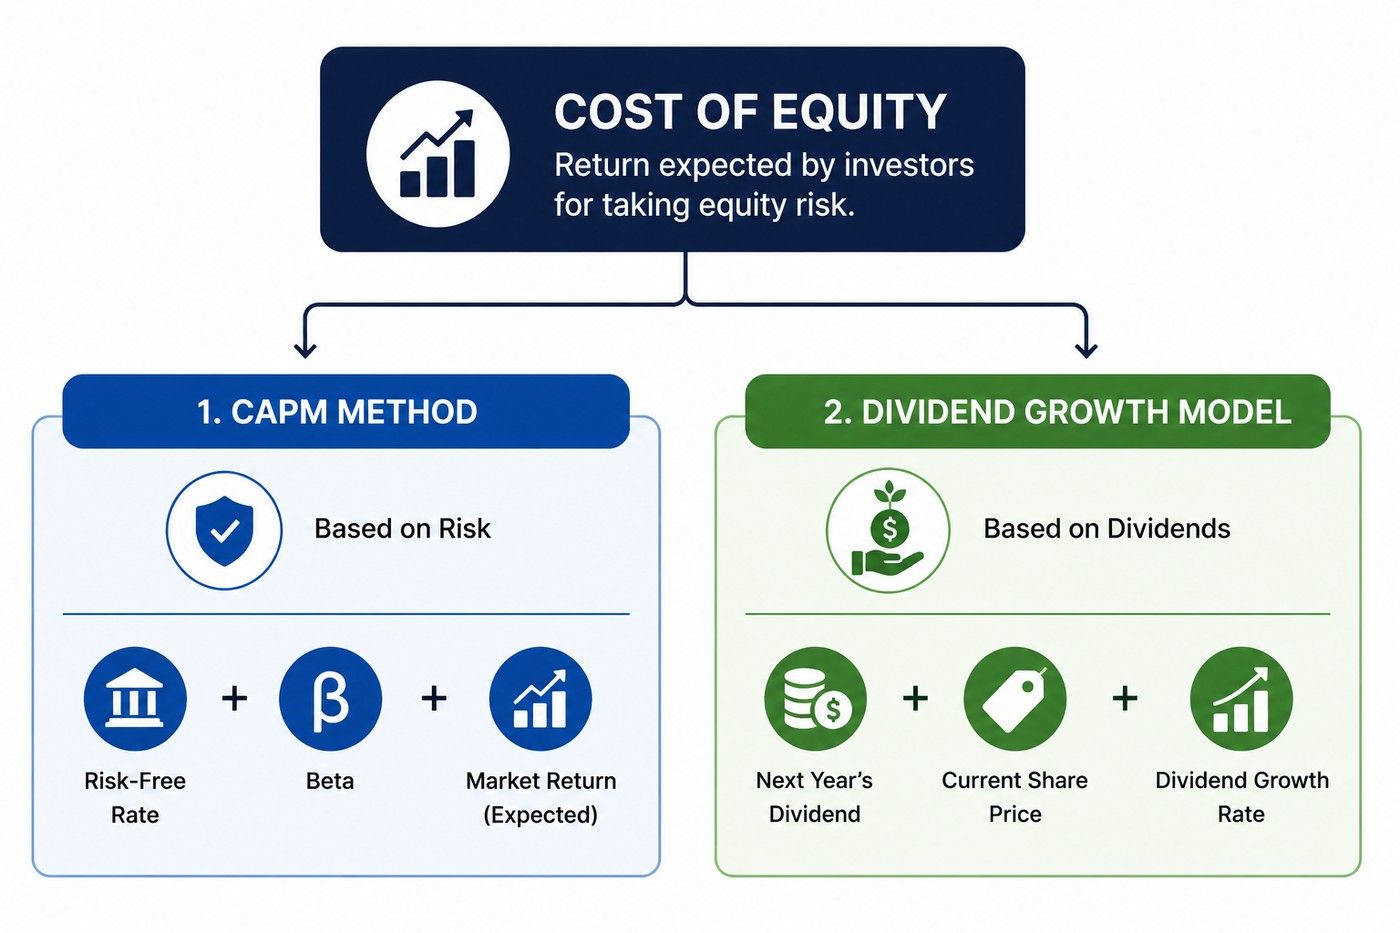
To calculate the cost of equity, there are two main methods. Each one looks at the problem from a different angle.
Both the formulas give the same number in the end: an estimate of what return shareholders expect. Let's discuss the cost of equity formulas in detail below.
Cost of Equity = Risk-Free Rate + Beta × (Market Return − Risk-Free Rate)
Here's what each term means:
That’s how, if a stock is riskier, investors demand a higher return to hold it. That pushes the cost of equity up.
Cost of equity calculation example with CAPM: assume risk-free rate is 5%, market return is 11%, and beta is 1.3.
So, the calculation will be
Cost of equity = 5% + 1.3 × (11% − 5%) = 12.8%
That means investors expect a 12.8% return to keep their money in that stock.
The dividend growth model formula doesn't care about volatility. It looks at what the company actually pays to shareholders, and how that payment is growing.
Cost of Equity = (Next Year's Dividend ÷ Current Share Price) + Dividend Growth Rate
Here's what each term means:
This method only works for companies that pay steady, and predictable dividends. For companies that don't pay dividends, this formula won't give a usable number.
Let’s take an example: assume next year's dividend is ₹2, current share price is ₹50, and dividend growth rate is 5%.
Cost of equity = (2 ÷ 50) + 5% = 4% + 5% = 9%
So, investors can expect a 9% return. This is based on the dividend income plus the growth in that dividend over time.
Also read: What Is Customer Lifetime Value? How To Calculate It?
Above, we understood the cost of equity calculation CAPM formula, just as an overview. Here, we'll break it down step by step, so you know exactly where each number comes from.
Risk-free rate is the return that you would get from an investment with virtually no risk of default.
Most analysts use the yield on a government bond for this, usually a 10-year Treasury bond. The concept is simple; this is the minimum return any investor would accept, since they could earn this much without taking stock market risk.
Let's assume the current risk-free rate is 4%.
Next, we will find the company's beta. Beta measures how much a stock moves compared to the overall market.
The beta is usually available on financial data platforms like Yahoo Finance, Bloomberg, or a company's investor relations page. So, you don't need to calculate it by hand.
If we assume our company has a beta of 1.5, this means it's riskier than the average market stock.
Equity risk premium is the extra return investors expect for choosing the stocks over a risk-free investment. The formula for this is as follows:
Equity Risk Premium = Market Return − Risk-Free Rate
Market return is the expected return of the overall stock market, this is often estimated using historical averages of an index like the S&P 500.
Let's assume the expected market return is 10%. So, the equity risk premium is:
10% − 4% = 6%
Now put every figure into the CAPM formula:
Cost of Equity = Risk-Free Rate + Beta × Equity Risk Premium
Using the numbers we assume:
Cost of Equity = 4% + 1.5 × 6%
Cost of Equity = 4% + 9%
Cost of Equity = 13%
So, this means investors expect a 13% return to hold this stock, given its risk level.
Also read: Why MBA in Finance is Worth It: Career & Growth Insights
Earlier, we introduced the Dividend Growth Model formula. Now, let's break down each step to understand how to calculate the cost of equity.
First check dividend the company is expected to pay next year, not the dividend it paid last year.
If the company has been increasing its dividend steadily, you can estimate next year's dividend by taking the most recent dividend and growing it by the expected growth rate.
Let's assume, company paid a dividend of ₹2.85 this year, and it's expected to grow. Based on that growth, next year's dividend comes out to ₹3.
Next, find the current market price of the stock. You can find this from any stock exchange listing or financial platform, as it's publicly available in real time.
Now, let's assume the current share price is ₹75.
Here, estimates how fast the company's dividend has been growing; this is usually based on its dividend history over the past several years.
You can do this by looking at the dividend growth over a few years and calculate the average annual growth rate. Companies that grow earnings steadily tend to grow dividends steadily too.
Let's say the company's dividend growth rate comes out to 6%.
Now put all three numbers we assume into the formula:
Cost of Equity = (Next Year's Dividend ÷ Current Share Price) + Dividend Growth Rate
Using our numbers:
Cost of Equity = (3 ÷ 75) + 6%
Cost of Equity = 4% + 6%
Cost of Equity = 10%
This means investors expect a 10% return from stock, combining the dividend income and the growth in that dividend over time.
Remember, this method only works for companies with a stable, predictable dividend history. If a company doesn't pay dividends, or its payments are inconsistent, this formula won't give you a reliable number, and CAPM is the better choice in that case.
Take the next step in your finance career with a Master of Business Administration from O.P. Jindal Global University.
A side-by-side comparison of both the methods:
| Factor | CAPM | Dividend Growth Model |
| Main factors | Risk-free rate, beta, market return | Dividend, share price, growth rate |
| Is a Dividend required? | No | Yes |
| Risk consideration | Directly accounts for market risk | Doesn't look at risk directly |
| Best suited for | Most types of companies | Companies that pay steady dividends |
| Complexity | Slightly more complex; requires beta and market data | Simpler, requires fewer inputs |
| Data availability | Beta and market return are easy to find online | Needs a steady dividend history |
| Market sensitivity | Reflects current market trends | Doesn't factor in market changes much |
| Common users | Analysts, bankers, finance teams | Investors who focus on dividend stocks |
Also read: 20+ Must-Have Finance Skills For Success in 2026
Even though the formulas look simple, people often get the numbers wrong. Here are some common mistakes to check and not repeat.
Using a short-term bond yield instead of a long-term one. This can give you a wrong calculated number. Stick to a long-term government bond, like a 10-year Treasury, as it matches the long-term nature of stock investing.
Beta changes over time as a company's business and risk profile change. Using an old beta number can give you a cost of equity that is not related to the company. Before calculating, always check that you're using a recent beta.
Some people plug in last year's market return instead of the expected future return. The market return in CAPM should reflect what investors expect going forward, not just what happened in the past.
The growth rates change over time. So, assuming a company's dividend will grow at the same rate forever, especially a high rate, can overstate or understate the true cost of equity.
Sometimes people treat the final number as exact. But that number is not final. It's based on assumptions about risk, market return, and growth, all of which can change. Small changes in these inputs can lead to noticeably different results.
Also read: Is an Online MBA Worth It in 2026? ROI, Salary & Career Growth Explained
The cost of equity is based on the simple idea that shareholders take risk, so they expect a return for it. Whether CAPM or the Dividend Growth Model is used, you're just trying to estimate what that expected return looks like.
CAPM works for most companies and directly accounts for risk through beta. The Dividend Growth Model is simpler, but it only makes sense for companies with a steady dividend history.
Neither method gives you an exact number. Both are estimates based on assumptions, and those assumptions can change. So, it's worth treating the cost of equity as a useful guide, not a fixed fact.
Ready to start your journey? Book a free consultation with upGrad today to find the best path for your career.
The formula is WACC = (E/V × Cost of Equity) + (D/V × Cost of Debt × (1 − Tax Rate)). Here, E is equity value, D is debt value, and V is total capital (E+D). It blends the cost of both equity and debt financing.
Use the CAPM method: Cost of Equity = Risk-Free Rate + Beta × (Market Return − Risk-Free Rate). This gives the equity portion of WACC. Multiply it by the equity weight (E/V) before adding it to the debt portion.
Cost of equity is the return expected by shareholders alone. WACC is broader. It combines cost of equity and cost of debt, weighted by how much of each a company uses to fund its operations.
It means the company must earn at least 12% on its investments to satisfy both shareholders and lenders. Anything below that destroys value. Anything above it creates real returns for investors.
Most companies fall between 8% and 12%, though it varies by industry and risk level. Capital-intensive or risky sectors tend to have higher WACC, while stable, low-risk businesses usually sit on the lower end.
WACC helps investors judge whether a company is generating enough returns to justify its risk. It's also used to discount future cash flows, making it essential for valuing stocks and evaluating investment decisions.
Beta measures a stock's volatility versus the market. A higher beta raises the cost of equity, which in turn increases WACC. Riskier, more volatile companies end up with a higher overall cost of capital.
Equity holders take on more risk than lenders, since they get paid after debt holders and have no guaranteed return. This extra risk means investors demand a higher return, pushing cost of equity above cost of debt.
The Global Industry Classification Standard (GICS) divides equities into 11 sectors: Energy, Materials, Industrials, Consumer Discretionary, Consumer Staples, Healthcare, Financials, Information Technology, Communication Services, Utilities, and Real Estate.
1 equity of 1 crore usually refers to a company's equity value being worth ₹1 crore, meaning the total worth of shareholder ownership in the business amounts to ₹1 crore based on share price and shares outstanding.
Yes, WACC isn't fixed. It shifts as interest rates, market conditions, company risk, or the mix of debt and equity financing change. Companies typically recalculate it periodically to keep valuations and decisions accurate.
1171 articles published
We are an online education platform providing industry-relevant programs for professionals, designed and delivered in collaboration with world-class faculty and businesses. Merging the latest technolo...
Speak with MBA expert
By submitting, I accept the T&C and
Privacy Policy
From MBA to Dream Job - Explore Our Alumni Success Stories
Top Resources
Master's Degree
12 Months
Master's Degree
13 Months
O.P.Jindal Global University
MBA (with Career Acceleration Program by upGrad)Become interview ready with Career Services
Master's Degree
12 Months