All courses
Agentic AI
Agentic AI
Artificial Intelligence
Degree / Exec. PG

IIIT Bangalore
Executive Diploma in Machine Learning and AI
OPJ Global University
Master’s Degree in Artificial Intelligence and Data Science
Liverpool John Moores University
Master of Science in Machine Learning & AI
Golden Gate University
DBA in Emerging Technologies with Concentration in Generative AIExecutive Certificate

IIITB & IIM, Udaipur
Chief Technology Officer & AI Leadership Programme
IIIT Bangalore
Executive Programme in Generative AI for Leaders
upGrad | Microsoft
Gen AI Mastery Certificate for Software DevelopmentupGrad | Microsoft
Gen AI Mastery Certificate for Managerial ExcellenceOffline Bootcamps

upGrad
Data Science and AI-MLDoctorate
For All Domains
IIITB & IIM, Udaipur
Chief Technology Officer & AI Leadership Programme
Swiss School of Business and Management
Global Doctor of Business Administration from SSBM
Edgewood University
Doctorate in Business Administration by Edgewood UniversityGolden Gate University
Doctor of Business Administration From Golden Gate University
Rushford Business School
Doctor of Business Administration from Rushford Business School, Switzerland-d9bdeff6165f4eb1ba2adcebde78e961.svg)
University of Waterloo
Chief Technology and AI Officer ProgramLeadership / AI
Golden Gate University
DBA in Emerging Technologies with Concentration in Generative AIMachine Learning
Machine Learning
Data Science
Degree / Exec. PG
O.P Jindal Global University
Master’s Degree in Artificial Intelligence and Data ScienceIIIT Bangalore
Executive Diploma in Data Science & AILiverpool John Moores University
Master of Science in Data ScienceExecutive Certificate
upGrad | Microsoft
Gen AI Foundations Certificate Program from MicrosoftupGrad | Microsoft
Gen AI Mastery Certificate for Data AnalysisupGrad | Microsoft
Gen AI Mastery Certificate for Software DevelopmentupGrad | Microsoft
Gen AI Mastery Certificate for Managerial ExcellenceupGrad | Microsoft
Gen AI Mastery Certificate for Content CreationOffline Bootcamps
upGrad
Data Science and AI-MLMBA
Masters

Liverpool School of Business
Master of Business Administration from Liverpool Business School with IIM Udaipur Certification
Paris School of Business
Master of Science in Business Management and TechnologyO.P.Jindal Global University
MBA (with Career Acceleration Program by upGrad)Edgewood University
MBA from Edgewood UniversityO.P.Jindal Global University
MBA from O.P.Jindal Global UniversityExecutive Certificate

IMT, Ghaziabad
Advanced General Management ProgramMarketing
Executive Certificate
upGrad | Microsoft
Gen AI Foundations Certificate Program from MicrosoftupGrad | Microsoft
Gen AI Mastery Certificate for Content CreationOffline Bootcamps
upGrad
Digital MarketingManagement
Degree
O.P Jindal Global University
MSc in International Accounting & Finance (ACCA integrated)
Golden Gate University
Master of Arts in Industrial-Organizational PsychologyExecutive Certificate

IIIT-B & IIM, Udaipur
Chief Technology Officer & AI Leadership ProgrammeIIIT-B & IIM, Udaipur
Chief Data and AI Officer Programme
IIM Kozhikode
Human Resource Analytics Course from IIM-KupGrad | Microsoft
Gen AI Foundations Certificate Program from MicrosoftEducation
Education

Northeastern University
Master of Education (M.Ed.) from Northeastern UniversityEdgewood University
Doctor of Education (Ed.D.)Edgewood University
Master of Education (M.Ed.) from Edgewood UniversityCertifications
Project Management
Certification

Knowledgehut
Leadership And Communications In ProjectsKnowledgehut
Microsoft Project 2007/2010-ae8d039bbd2a41318308f8d26b52ac8f.svg)
Knowledgehut
Financial Management For Project ManagersKnowledgehut
Fundamentals of Earned Value Management (EVM)Knowledgehut
Fundamentals of Portfolio ManagementKnowledgehut
Fundamentals of Program Management-35c169da468a4cc481c6a8505a74826d.webp&w=128&q=75)
Knowledgehut
CAPM® CertificationsKnowledgehut
Microsoft® Project 2016Certifications & Trainings
-7f4b4f34e09d42bfa73b58f4a230cffa.webp&w=128&q=75)
Knowledgehut
PMP® CertificationKnowledgehut
PMI-RMP® CertificationKnowledgehut
PMP Renewal Learning PathKnowledgehut
Oracle Primavera P6 V18.8Knowledgehut
Microsoft® Project 2013Knowledgehut
PfMP® Certification CourseKnowledgehut
Project Planning and MonitoringPrince2 Certifications

Knowledgehut
PRINCE2® FoundationKnowledgehut
PRINCE2® PractitionerKnowledgehut
PRINCE2 Agile Foundation and PractitionerKnowledgehut
PRINCE2 Agile® Foundation CertificationKnowledgehut
PRINCE2 Agile® Practitioner CertificationManagement Certifications
Knowledgehut
Project Management Masters Certification ProgramKnowledgehut
Change ManagementKnowledgehut
Project Management TechniquesKnowledgehut
Product Management Certification ProgramKnowledgehut
Project Risk Management- Study abroad
- Offline centres
- uGSOT - B.Tech
More
%20(2)-db0b6f38da9c485faf76e366793c9b9e.webp&w=128&q=75)


Data Science Courses
Learn Data Science from basics to advance with hands-on projects, real datasets, and tools like Python, SQL, and Machine Learning. Build skills that help you analyze data, find insights, and grow into roles like Data Analyst, Data Scientist, or ML Engineer.
Certificate in Data Science courses with GenAI integrated curriculum
Get to study with top-tier faculty at IIIT Bangalore and LJMU
Learn Python, Machine Learning, AI, Tableau, and SQL designed for industry needs
-80f5aca04e9b49ca9902fe2806c12f6e.webp&w=3840&q=75)
Career Support
57% Avg Salary Hike
Career Coaching


Our Top University Partners for Data Science Programs
How AI-Ready Is Your Career?
The work you do today may already be easy for AI to replace. Find out where you truly stand.
Automation risk in your profile
Skill relevancy for AI roles
Ability to adapt
🧠 Discover how future-ready your career really is
-d7bcc89c78df4cff8b2140ff79f1ffb1.webp&w=1200&q=75)
Learn by Doing
16+
Industry projects to choose from


Learn Data Science From The Best Instructors
8
Instructors
10
Industry Experts


-39a9e7a7278a441ea08a60a1f45b4913.png&w=128&q=75)


What Our Learners Have To Say About Data Science Course


How can upGrad support you?
Access the various career developement support services offered by upGrad to help you achieve your dream career and professional goals
You can write to us via studentsupport@upgrad.com or for urgent queries use the " Talk to Us" option on the learning platform
We are always there to support our online data science course learners on demand.


Data Science Course Overview
Nowadays, data surrounds us all. Companies use data to make decisions that help them be more efficient and effective.
With Data Science, you get to explore this data. Data Science enables you to analyze, forecast, and provide solutions through data. With upGrad Data Science courses, you will be able to master data science concepts to enhance your career as a professional.
Whether you are working in technology, business, or non-technical fields, you will learn how to implement data into your work.
What is Data Science?
Data Science is a field that uses scientific methods and algorithms to turn a raw data into a data which can be used further for better decision making.
It includes steps like collecting data, fixing errors, analyzing it, and building models to predict outcomes.
To do all this, you use a mix of mathematics and statistics to understand patterns and make sense of data. You also use programming languages like Python and SQL to handle data and build models. Machine learning helps you create systems that can predict results, and data visualization helps you present insights in a clear way.
Real-Life Uses of Data Science
Data science is not for any specific sector. It is applicable to all industries in one way or another:
· Companies can use it to understand their customers’ behaviors and increase their sales
· Finance institutions can use it to mitigate risks and anticipate upcoming trends
· Healthcare organizations can utilize it to analyze patients' information and enhance their treatment procedures
· Advertising agencies can use data science to plan their marketing strategies and target their potential customers effectively
In essence, data science allows people to make more informed decisions based on factual evidence rather than making assumptions.
Who Should Take a Data Science Course?
Data Science courses are good for you if you want to work with data in your job and improve your skills.
You learn how data is used in real situations and how you can use it to solve problems, make better decisions, and understand trends.
Software and Data Professionals
If you are already working with software, data, or analytics and want to grow, this course helps you move to the next level. You can:
- Build data-driven solutions
- Work with real datasets
- Take up more advanced roles
System Architects and Team Managers
If your role includes handling systems or leading teams, Data Science helps you understand how data flows and how to use it better. You can:
- Design better data processes
- Guide your team with data insights
- Make smarter decisions
Product Owners and Business Leaders
If you manage products or business goals, Data Science helps you use data in daily work. You can:
- Make decisions based on data
- Track performance clearly
- Improve business results
Students and Early Career Professionals
If you are new and have basic knowledge of programming, this course helps you learn step by step. You can:
- Understand how data works
- Practice with simple projects
- Build confidence
Professionals from Non-Tech Backgrounds
If you are in marketing, finance, operations, or any other field, Data Science helps you bring data into your work. You can:
- Use data in your daily tasks
- Get better insights
- Stay updated with new skills
Why Choose Data Science Courses in 2026?
Data is no longer used only for reports. Businesses now use it in daily operations, products, and planning. When you learn Data Science, you can solve real problems and help companies take better decisions.
Here are some reasons why professionals are choosing Data Science courses in 2026:
- Data Science and Analytics jobs in India are experiencing massive growth, with projections suggesting a 30–35% increase in openings by 2026-2027
- India is expected to have over 11 million job openings in data-related roles by 2026
- Around 65% of organizations already use data analytics to drive business decisions
- The global Data Science platform market is expected to reach $300+ billion by 2030
In simple terms, learning Data Science can help you:
- Build skills that companies need right now
- Work on real datasets and business problems
- Move into roles with better growth and salary
- Stay relevant in a data-driven job market
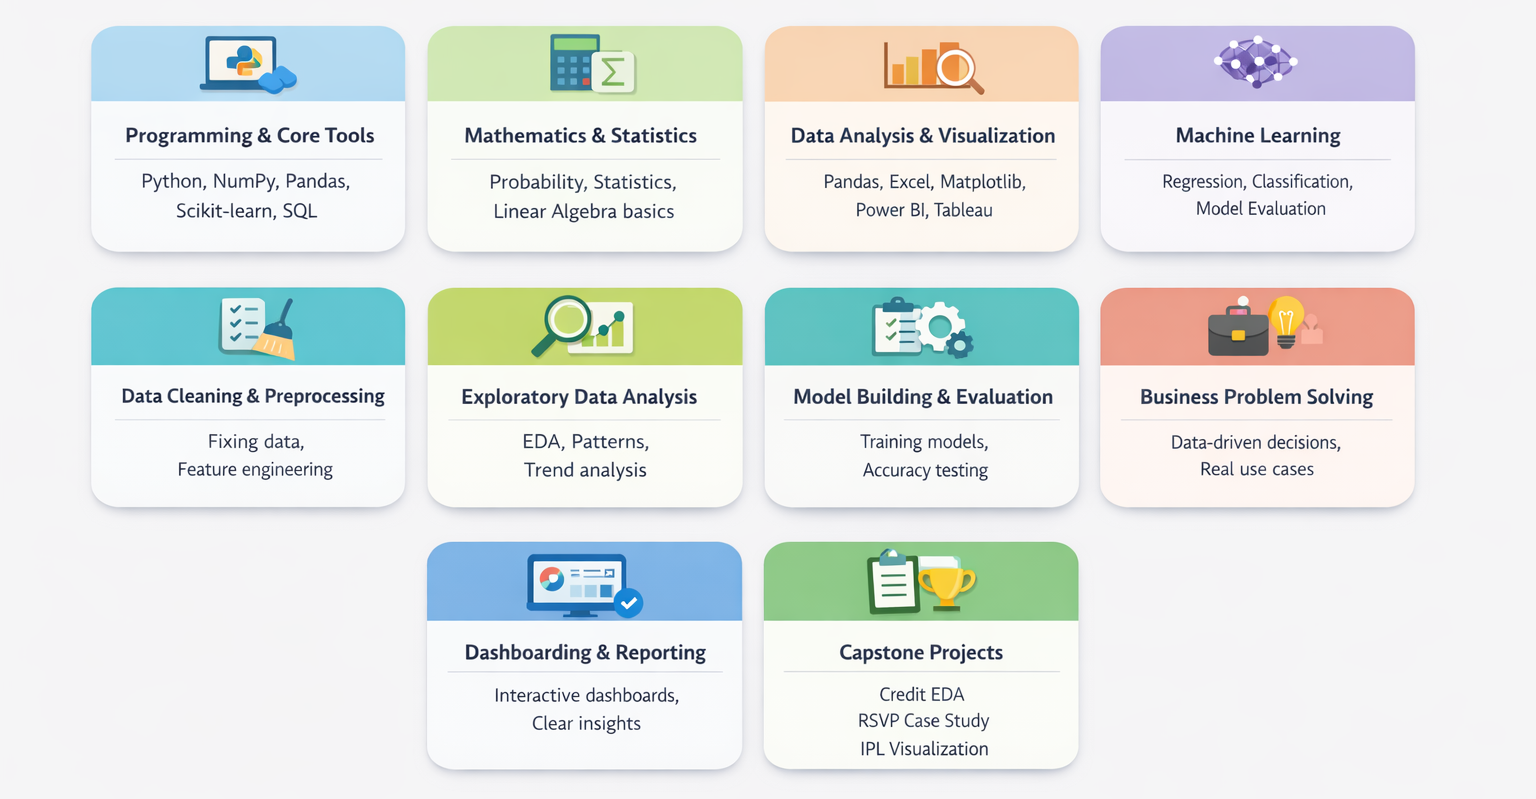
What You Will Learn in Data Science Online Courses?
Data Science courses help you go from basic understanding to working with real data and solving real problems.
These programs mix core concepts, hands-on practice, and real use cases so you can apply your learning in actual work.
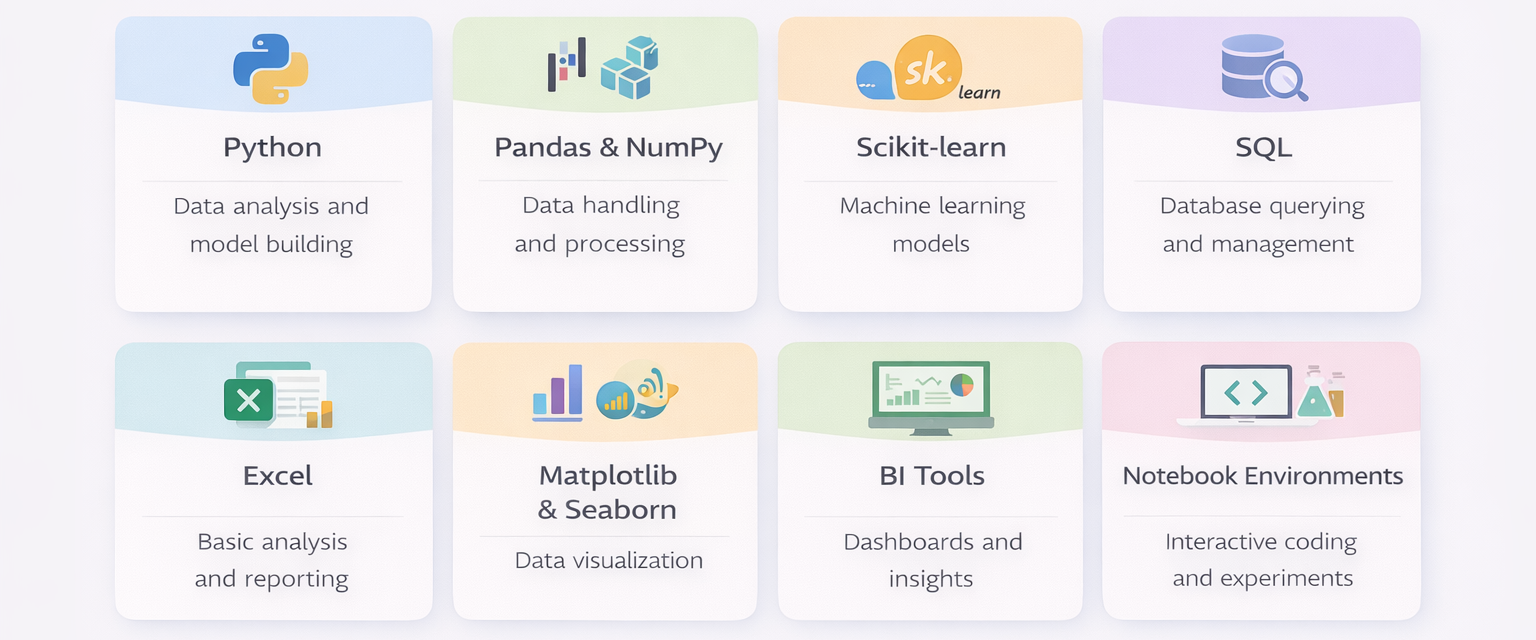
Tools and Technologies Covered in Data Science Courses
From data handling tools to visualization platforms, here are the tools you will learn in Data Science Online Courses:
Hands-On Projects in upGrad Data Science Courses
You cannot learn Data Science by only reading concepts. You need to work on real data to understand how things actually work. Employers also care about what you can build, not just what you know.
These Data Science Online Course include hands-on projects that help you apply your learning and build a strong portfolio.
1. Credit EDA Assignment
You will work on credit data to find patterns, clean the dataset, and study trends. This helps you understand how data is analyzed in real business cases.
Skills you learn: Data analysis, Pandas, NumPy, data cleaning, visualization
2. RSVP Case Study
You will analyze movie data and find insights about audience trends, ratings, and performance. This helps you understand how data supports decision-making in media and business.
Skills you learn: Data analysis, SQL, trend analysis, business insights
3. Bike Sharing Assignment
You will analyze bike rental data and find factors that affect demand. This helps you understand how data is used for forecasting and planning.
Skills you learn: Regression, EDA, feature analysis, data visualization
4. IPL Visualization Assignment
You will work on IPL data and create visual insights about teams, players, and match results. This helps you learn how to present data in a clear and useful way.
Skills you learn: Data visualization, storytelling, Python libraries
5. Airbnb Case Study
You will analyze Airbnb listing data to understand pricing, demand, and customer behavior. This helps you learn how businesses use data to improve decisions.
Skills you learn: EDA, data cleaning, business analysis, visualization
Career Outcomes After a Data Science Course: Salaries and Roles
The job market for Data Science professionals in India is growing fast. Companies pay well because they need people who can work with data and solve real problems.
There are more job openings than skilled people right now. This creates better chances for you to get good roles and salary growth.
Here are some roles you can explore after completing your Data Science Online Course:
Role | What You Will Do | Average Salary in India (₹ LPA) |
Machine Learning Engineer | Build and deploy models for predictions and automation | ₹8 – 20 LPA |
Data Scientist | Analyze data, build models, and solve business problems | ₹9 – 19.8 LPA |
Analytics Consultant | Help companies use data to improve performance and strategy | ₹8 – 16.4 LPA |
Data Engineer | Build and manage data pipelines and systems | ₹7 – 15 LPA |
Business Analyst | Use data to improve processes and guide business decisions | ₹6 – 12 LPA |
Data Analyst | Work with data, create reports, find trends, and support decisions | ₹4 – 10 LPA |
Note: These salary figures are based on data from Glassdoor and may vary depending on experience, location, and company.
Industries Hiring Data Science Professionals
Companies across many industries hire professionals with Data Science skills.
· IT Services and Software Products: You build data-driven products, improve systems, and work with large-scale applications.
· Banking, Financial Services, and Insurance: You analyze risk, detect fraud, and support financial decisions using data.
· E-commerce and Retail: You recommend products, manage inventory, and understand customer behavior.
· Healthcare and Life Sciences: You work with patient data, support diagnosis, and help in research.
· Consulting and Professional Services: You analyze data and help businesses make better decisions.
· Media and Content Platforms: You manage content, track user behavior, and personalize user experience.
Essential Resources to Navigate Your Data Science Journey
Data Science FAQs
1. What is a data science course online?
An online course in Data Science can help learners learn how to collect, analyze, and interpret data in order to solve problems in the real world. The course can help learners learn key skills in data science, such as programming in Python, statistics, machine learning, data visualization, and working with large data sets. Most data science programs have hands-on projects, case studies, and capstones, which help learners learn how to apply data science in the real world for business problems.
In short, a data science course can help learners learn the skills required to become data analysts, data scientists, or machine learning experts in today’s data-driven industries.
Unlike YouTube videos, data science programs can help learners learn the entire topics of data science, from programming in Python to machine learning.
2. What topics are covered in an online data science course?
A well-rounded online data science course will cover both the technology and the application.
Some topics include:
- Python for Data Science
- Statistics and Probability
- SQL and Data Querying
- Data Visualization using tools like Tableau, Power BI, or Matplotlib
- Machine Learning algorithms
- Deep Learning and Neural Networks
- Big Data basics such as Hadoop or Spark
- Generative AI and LLM fundamentals
- Capstone projects using real datasets
upGrad data science programs include these topics along with industry projects to help learners build practical data science skills.
3. What skills will learners develop in an online data science course?
Learners develop both technical and business skills during a data science course.
Technical skills
- Data cleaning/preprocessing
- Exploratory data analysis
- Model building and evaluation
- Feature engineering
- Basic deployment of models
Business skills
- Problem-solving with data
- Data storytelling and insight presentation
- Dashboard building
- Stakeholder communication
The data science course offered by upGrad has incorporated both skills in data science.
4. Does the course teach Python, R, SQL, and Machine Learning?
Yes. Online data science programs teach core programming languages and analytical tools required for data-driven roles. Most programs emphasize Python and SQL because industries widely use them. Learners study regression, classification, clustering, and model evaluation. Some programs also introduce R or comparative analytics, but Python typically remains the primary language for end-to-end workflows.
5. Is deep learning part of a data science course?
Yes. Comprehensive programs include deep learning, especially at intermediate to advanced levels. Foundational courses begin with Python, statistics, and machine learning, while advanced modules introduce neural networks and AI techniques used in image recognition, NLP, and predictive modeling.
Typical deep learning topics include:
- Neural networks
- Convolutional Neural Networks (CNNs)
- Recurrent Neural Networks (RNNs)
- Deep learning frameworks such as TensorFlow and Keras
Programs from upGrad that include deep learning components:
- Post Graduate Diploma in Data Science with IIIT Bangalore
- MSc in Data Science from Liverpool John Moores University
6. What is the syllabus of an online data science program?
A structured syllabus typically progresses in this sequence:
Programming foundations → Math and statistics → Data analysis and visualization → Machine learning → Advanced AI / deep learning → Industry capstone project.
7. Are math and statistics mandatory for data science courses?
Yes. Math and statistics play an important role in data science because they help explain how models analyze data and make predictions.
Common concepts used include:
- Statistics and probability for data analysis
- Linear algebra for machine learning algorithms
- Basic calculus for optimization techniques
You do not need advanced mathematics to begin. Many upGrad data science courses introduce these concepts step by step while focusing on practical applications.
8. Can a non-technical student complete an online data science course?
Yes. You can start learning Data Science even without a technical background.
Why it’s possible
- Courses are designed for beginners from commerce, arts, or any field
- You start with basics before moving to advanced topics
- No prior coding experience is required
What helps you succeed
- Consistent practice with coding and data tasks
- Building small projects step by step
- Staying regular with learning
Programs from upGrad begin with foundational topics, so you can gradually build skills in programming, data analysis, and machine learning.
9. Do learners need programming experience before starting?
No. Many beginner-friendly programs teach Python or R from scratch. However, learners must develop coding skills during the course because programming supports data cleaning, analysis, and model building.
10. Are math and statistics mandatory?
Yes. Foundational mathematics and statistics support data analysis, machine learning, and model evaluation. Programs typically teach required concepts from the beginning, so learners build confidence gradually.
11. Is an online data science course hard?
An online data science course can feel challenging at first because it combines programming, statistics, and analytical thinking. Learners need to understand data, write code, and apply machine learning techniques to solve problems.
However, most learners manage the course successfully with structured learning and consistent practice.
Common challenges include:
- Learning Python programming and data analysis tools
- Understanding statistics and probability concepts
- Building and evaluating machine learning models
- Working with real datasets and data preprocessing
These challenges become easier when learners follow a structured curriculum, practice coding regularly, and complete projects. upGrad data science programs support learners through guided modules, practical assignments, and project-based learning, which helps simplify complex concepts.
12. How should learners prepare before enrolling?
Learners should review basic Python, revise statistics concepts, and practice simple data analysis using spreadsheets. Exploring introductory machine learning resources and improving logical reasoning also helps.
13. What do people review about popular data science courses?
Learners usually highlight several positive aspects when reviewing popular data science courses.
Common positive feedback includes:
- Hands-on projects and real datasets that help learners build practical skills
- Structured curriculum that explains tools like Python, SQL, and visualization step by step
- Mentorship and instructor guidance that make complex concepts easier to understand
- Career support services such as resume guidance and interview preparation
- Portfolio-building opportunities through capstone projects and case studies
Programs such as upGrad data science courses are often appreciated for combining structured learning with practical projects and career-oriented training.
14. Which online course is best for Data Science beginners?
Some data science courses for beginners begin with programming in Python and statistics. Projects are included in these data science courses. Structured learning is also included in these data science courses for beginners.
Some of the data science courses for beginners offered by upGrad are:
- Post Graduate Diploma in Data Science (IIIT Bangalore)
- Post Graduate Certificate in Data Science (IIIT Bangalore)
- Advanced Certification in Data Science & Generative AI (IIIT Bangalore)
15. What is the duration of a typical online data science course?
The duration depends on the program level.
- Certificate programs: 4–6 months
- Postgraduate diplomas: 9–12 months
- Master’s degrees: 12–24 months
- Bootcamp programs: 4–6 months
Most working professionals study 8–12 hours per week while completing upGrad data science programs part-time.
16. Do online data science courses include projects and real datasets?
Yes. Structured online data science programs actively train learners through practical work rather than theory alone. These courses include real-world datasets, guided lab exercises, case studies, and end-to-end projects that mirror actual business challenges.
Learners typically clean raw data, build predictive models, evaluate performance, and present insights just as professionals do in industry settings. Many advanced programs also include capstone projects where learners solve complex problems using multiple tools and techniques. This hands-on approach helps learners understand how data science operates in real environments.
17. Which courses focus more on Data analytics vs machine learning?
Different data science courses have different career paths.
Data Analytics-focused courses cover skills required for data extraction, such as SQL, data visualization tools, dashboards, and business reporting. The course helps learners understand data trends, decision-making, and clear expression of data insights.
Machine learning-focused courses cover predictive modeling and development of machine learning algorithms. Learners can take data science programs from upGrad, which offer both data analytics and machine learning, depending on the learners’ interests in data analytics or machine learning careers.
18. Which online data science course provides a certificate?
There are several programs that offer data science certifications after the completion of the course and assessment.
Examples of such programs offered by upGrad are:
- Post Graduate Diploma in Data Science (IIIT Bangalore)
- MSc in Data Science (Liverpool John Moores University)
- MSc in AI & Data Science (Jindal Global University)
- Advanced Certification in Data Science & Generative AI
19. Can learners earn a degree online in data science?
Yes. Many universities offer fully online data science degrees that follow formal academic standards. These programs include structured coursework, graded assignments, research components, and major projects similar to on-campus programs. Learners gain flexibility while still completing rigorous academic training.
Online degrees often integrate industry projects, mentorship, and applied learning so students develop both theoretical knowledge and practical experience. Graduates typically earn the same recognised degree as on-campus students, making these programs suitable for long-term academic and professional advancement.
20. Can online courses replace a formal college degree?
Online courses can support career transitions, especially when they provide strong practical training, recognised certification, and industry-relevant projects. Many employers prioritise demonstrable skills, portfolios, and real problem-solving ability rather than only academic credentials.
However, traditional degrees still carry value for academic research roles or structured career paths. Well-designed online programs can complement or, in some cases, substitute formal education by delivering applied expertise, mentorship, and professional exposure that prepares learners for industry work.
21. Are free data science courses good for beginners?
Yes. Free data science courses are useful for beginners who want to explore foundational topics such as Python basics, data analysis, and introductory machine learning. They help learners understand the field before committing to a full program.
Free courses are best for:
- Learning basic concepts
- Exploring interest in data science
- Understanding tools and terminology
However, many free courses do not include structured learning paths, mentorship, or industry projects. Learners often move to structured programs such as upGrad data science courses for deeper training and career preparation.
22. Is a paid certification better than a free course?
Paid certifications generally provide more structured and comprehensive learning experiences. They typically include guided curriculum, graded assessments, hands-on projects, mentorship, and recognised credentials. Many also offer career services such as resume feedback, interview preparation, and hiring support.
While free courses introduce basic concepts, paid programs usually develop deeper technical skills and practical experience. Learners who want career transition or professional credibility often benefit more from structured paid certification programs.
23. How can learners verify if a course is worth paying for?
Learners should review several factors before paying for a course to ensure it provides real value.
Important aspects to evaluate include:
- Curriculum quality to check if it covers both theory and practical applications
- Hands-on projects that allow learners to work with real datasets or business problems
- Mentorship and instructor support for guidance during the course
- Industry tools and technologies included in the training
- Certification credibility and university partnerships
- Career support services such as resume guidance and interview preparation
- Student reviews and alumni outcomes
Programs that combine structured learning, practical projects, and recognized certification, such as many upGrad data science courses, often provide stronger long-term learning value.
24. Is an online data science course worth it?
Yes, if you choose a structured Data Science course and actively build skills.
Why it’s worth it
- You learn practical tools used in real jobs
- You work on projects based on real data problems
- You build a portfolio to show employers
- You gain skills for data-driven roles
What adds real value
- Hands-on projects and case studies
- Mentorship and feedback
- Training on industry tools
Programs from upGrad include project-based learning and career guidance, helping you prepare for real-world data roles.
25. What are the career options after completing a data science course?
Graduates of data science programs can pursue several specialised roles depending on their skills and interests. Common career paths include:
- Data Analyst focuses on interpreting data and generating insights
- Business Analyst supports organisational decision-making through data interpretation
- Data Scientist builds predictive models and advanced analytics systems
- Machine Learning Engineer develops and deploys AI models
- AI Engineer designs intelligent applications and automation systems
Each role uses data-driven methods to solve real-world problems across industries.
26. What is the average salary after a data science course in India?
Salary levels vary based on experience, skill depth, and job role.
- Entry-level professionals typically earn between ₹5 and ₹10 lakh per annum.
- Early-career specialists with strong project experience often earn ₹10 to ₹25 lakh annually.
- Mid-level professionals with advanced expertise and industry exposure may earn ₹25 lakh or more per year.
Salaries increase further for specialised roles such as machine learning engineers or AI experts with significant experience.
27. What skills do employers expect?
Employers expect a combination of technical and professional capabilities.
Technical skills
- Python and SQL programming
- Data cleaning and preprocessing
- Machine learning model development
- Model evaluation and optimisation
- Data visualisation and reporting
Business skills
- Analytical problem-solving
- Statistical reasoning
- Clear communication of insights
- Understanding real business objectives
Professionals who combine technical expertise with business awareness are highly valued.
28. Do online courses help learners get jobs?
Yes. Online courses help you build technical knowledge, practical skills, and project portfolios that support job applications.
Many structured programs also provide:
- Resume building guidance
- Mock interview preparation
- Networking opportunities
- Hiring partner referrals
upGrad programs include career support and industry projects that help learners prepare for data science and technology roles. Job outcomes still depend on skill mastery, portfolio strength, and consistent preparation.
29. Which courses offer placement support or job guarantee?
Some Data Science courses offer placement support to help you move into job roles.
What placement support usually includes
- Resume building and profile review
- Interview preparation and mock interviews
- Career coaching and guidance
- Networking with hiring partners
Programs from upGrad provide placement assistance through:
- Hiring partner connections
- Structured interview prep sessions
- Ongoing career support
Job guarantees are rare, but strong support can improve your chances of getting hired.
30. How long does it take to become job-ready after an online data science course?
Most learners become job-ready within six to twelve months of consistent study and practice. This timeline assumes regular learning, project completion, and skill development. Learners who dedicate weekly study time, complete hands-on assignments, and build strong portfolios typically progress faster. The exact duration depends on prior knowledge, program intensity, and individual commitment.
31. Which are the best data science courses online?
Several programs have been designed to provide academic learning and hands-on training. Some of the popular programs offered by upGrad include:
- Master’s in Data Science (Liverpool John Moores University)
- Executive Post Graduate Certificate in Data Science & AI (IIIT Bangalore)
- Post Graduate Diploma in Data Science (IIIT Bangalore)
- Professional Certificate in Data Science & Generative AI
These programs provide a structured learning path, projects, and certifications to help students grow in the field of data science.
32. What are the best beginner courses vs advanced ones?
Courses differ based on experience level and learning depth.
Beginner courses
Beginner programs focus on foundational skills before introducing advanced analytics.
Examples from upGrad include:
- Post Graduate Certificate in Data Science (IIIT Bangalore)
- Advanced Certification in Data Science & Generative AI
These courses usually teach:
- Python basics
- Statistics and probability
- Data visualization and SQL
- Introductory machine learning
- Small projects with guided support
Advanced courses
Advanced programs focus on specialized technical skills and real-world applications.
Examples from upGrad include:
- Post Graduate Diploma in Data Science (IIIT Bangalore)
- Executive Diploma in Data Science & AI (IIIT Bangalore)
- Master’s in Machine Learning and AI (Liverpool John Moores University)
These programs usually cover:
- Advanced machine learning algorithms
- Deep learning and neural networks
- Big data systems and AI applications
- Large industry projects and capstone research
Simple way to choose
- Choose beginner courses if you are new to programming or data science.
- Choose advanced courses if you already know Python and want deeper AI or machine learning expertise.
upGrad Learner Support
Talk to our experts. We are available 7 days a week, 10 AM to 7 PM
Indian Nationals
Foreign Nationals


-4c349343809f452a8b692e3368cd8097.webp&w=3840&q=75)