All courses
Agentic AI
Agentic AI
Artificial Intelligence
Degree / Exec. PG

IIIT Bangalore
Executive Diploma in Machine Learning and AI
OPJ Global University
Master’s Degree in Artificial Intelligence and Data Science
Liverpool John Moores University
Master of Science in Machine Learning & AI
Golden Gate University
DBA in Emerging Technologies with Concentration in Generative AIExecutive Certificate

IIITB & IIM, Udaipur
Chief Technology Officer & AI Leadership Programme
IIIT Bangalore
Executive Programme in Generative AI for Leaders
upGrad | Microsoft
Gen AI Foundations Certificate Program from MicrosoftupGrad | Microsoft
Gen AI Mastery Certificate for Data AnalysisupGrad | Microsoft
Gen AI Mastery Certificate for Software DevelopmentupGrad | Microsoft
Gen AI Mastery Certificate for Managerial ExcellenceOffline Bootcamps

upGrad
Data Science and AI-MLDoctorate
For All Domains
IIITB & IIM, Udaipur
Chief Technology Officer & AI Leadership Programme
Swiss School of Business and Management
Global Doctor of Business Administration from SSBM
Edgewood University
Doctorate in Business Administration by Edgewood UniversityGolden Gate University
Doctor of Business Administration From Golden Gate University
Rushford Business School
Doctor of Business Administration from Rushford Business School, SwitzerlandGolden Gate University
Master + Doctor of Business Administration (MBA+DBA)-d9bdeff6165f4eb1ba2adcebde78e961.svg)
University of Waterloo
Chief Technology and AI Officer ProgramLeadership / AI
Golden Gate University
DBA in Emerging Technologies with Concentration in Generative AIMachine Learning
Machine Learning
Data Science
Degree / Exec. PG
O.P Jindal Global University
Master’s Degree in Artificial Intelligence and Data ScienceIIIT Bangalore
Executive Diploma in Data Science & AILiverpool John Moores University
Master of Science in Data ScienceExecutive Certificate
upGrad | Microsoft
Gen AI Foundations Certificate Program from MicrosoftupGrad | Microsoft
Gen AI Mastery Certificate for Data AnalysisupGrad | Microsoft
Gen AI Mastery Certificate for Software DevelopmentupGrad | Microsoft
Gen AI Mastery Certificate for Managerial ExcellenceupGrad | Microsoft
Gen AI Mastery Certificate for Content CreationOffline Bootcamps
upGrad
Data Science and AI-MLupGrad
Data AnalyticsMBA
Masters

Paris School of Business
Master of Science in Business Management and TechnologyO.P.Jindal Global University
MBA (with Career Acceleration Program by upGrad)Edgewood University
MBA from Edgewood UniversityO.P.Jindal Global University
MBA from O.P.Jindal Global UniversityGolden Gate University
Master + Doctor of Business Administration (MBA+DBA)Executive Certificate

IMT, Ghaziabad
Advanced General Management ProgramMarketing
Executive Certificate
Offline Bootcamps
upGrad
Digital MarketingManagement
Degree
O.P Jindal Global University
MSc in International Accounting & Finance (ACCA integrated)Paris School of Business
Master of Science in Business Management and Technology
Golden Gate University
Master of Arts in Industrial-Organizational PsychologyExecutive Certificate

IIM Kozhikode
Human Resource Analytics Course from IIM-KupGrad | Microsoft
Gen AI Foundations Certificate Program from MicrosoftEducation
Education

Northeastern University
Master of Education (M.Ed.) from Northeastern UniversityEdgewood University
Doctor of Education (Ed.D.)Edgewood University
Master of Education (M.Ed.) from Edgewood UniversityCertifications
Project Management
Certification

Knowledgehut
Leadership And Communications In ProjectsKnowledgehut
Microsoft Project 2007/2010-ae8d039bbd2a41318308f8d26b52ac8f.svg)
Knowledgehut
Financial Management For Project ManagersKnowledgehut
Fundamentals of Earned Value Management (EVM)Knowledgehut
Fundamentals of Portfolio ManagementKnowledgehut
Fundamentals of Program Management-35c169da468a4cc481c6a8505a74826d.webp&w=128&q=75)
Knowledgehut
CAPM® CertificationsKnowledgehut
Microsoft® Project 2016Certifications & Trainings
-7f4b4f34e09d42bfa73b58f4a230cffa.webp&w=128&q=75)
Knowledgehut
PMP® CertificationKnowledgehut
PMI-RMP® CertificationKnowledgehut
PMP Renewal Learning PathKnowledgehut
Oracle Primavera P6 V18.8Knowledgehut
Microsoft® Project 2013Knowledgehut
PfMP® Certification CourseKnowledgehut
Project Planning and MonitoringPrince2 Certifications

Knowledgehut
PRINCE2® FoundationKnowledgehut
PRINCE2® PractitionerKnowledgehut
PRINCE2 Agile Foundation and PractitionerKnowledgehut
PRINCE2 Agile® Foundation CertificationKnowledgehut
PRINCE2 Agile® Practitioner CertificationManagement Certifications
Knowledgehut
Project Management Masters Certification ProgramKnowledgehut
Change ManagementKnowledgehut
Project Management TechniquesKnowledgehut
Product Management Certification ProgramKnowledgehut
Project Risk Management- Study abroad
- Offline centres
- uGSOT - B.Tech
More


49. Variance in ML
Guide to HDBSCAN in Machine Learning: Algorithm, Implementation & Use Cases
Did you know? HDBSCAN now supports long vectors in R’s dbscan package (Jan 2025), enabling it to handle much larger distance matrices for big data clustering tasks.
This enables processing distance matrices larger than 2^31 elements, allowing efficient clustering of bigger datasets and overcoming memory limitations in large-scale or high-dimensional data.
HDBSCAN (Hierarchical Density-Based Spatial Clustering of Applications with Noise) is an advanced clustering algorithm. It efficiently identifies clusters in data with varying densities while handling noise and outliers better than traditional methods.
It builds a cluster hierarchy and selects the most stable structures. This guide to HDBSCAN explains its core algorithm, key implementation steps using Python’s hdbscan library, and real-world applications.
HDBSCAN is especially useful in high-dimensional or noisy datasets. Use cases include customer segmentation, anomaly detection, and unsupervised pattern recognition. This guide explains how the HDBSCAN algorithm works, outlines steps for implementing it using Python libraries like hdbscan.
Hone your skills in ML and AI with upGrad’s Artificial Intelligence & Machine Learning - Courses, designed in collaboration with the world’s top 1% universities. Join over 1,000 leading companies and unlock an average 51% salary hike while learning from industry experts!
What is HDBSCAN Clustering in Machine Learning? Core Concepts
HDBSCAN in ML is a clustering algorithm used to find patterns or groupings in unlabeled data without needing to specify the number of clusters. It improves on DBSCAN by handling datasets with varying densities and identifying noise more effectively.
HDBSCAN is commonly used in machine learning tasks like customer segmentation, anomaly detection, and image analysis, where traditional clustering methods may struggle. It is valued for its flexibility, minimal parameter tuning, and ability to reveal meaningful structure in complex datasets.
Planning to take your career to the next level by learning ML and AI, here are some top-rated courses to help you get there:
- Masters in Artificial Intelligence and Machine Learning
- Executive Diploma in Machine Learning and AI
- Master’s Degree in Artificial Intelligence and Data Science
Importance of HDBSCAN Clustering in ML
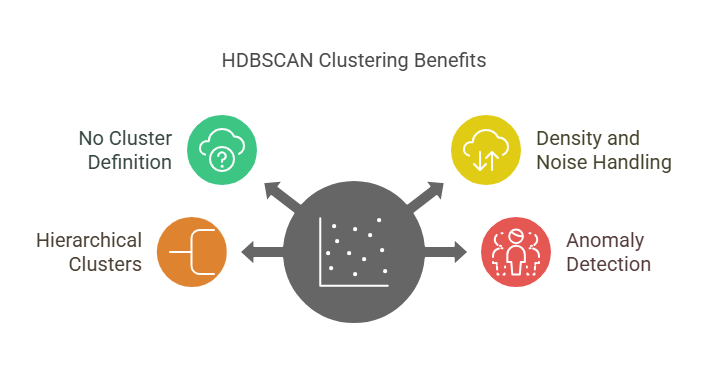
HDBSCAN in ML is crucial as it adapts to datasets with varying densities. It automatically identifies meaningful patterns and outliers without requiring a predefined number of clusters. Its ability to handle noise and reveal hierarchical structures makes it ideal for large-scale data analysis.
- No need to define the number of clusters: HDBSCAN automatically determines the optimal number of clusters based on data density, removing the need for manual input. For example, in customer segmentation, HDBSCAN identifies distinct groups of high-value customers based on spending behavior, without the need to specify the number of clusters in advance.
- Effective with data of varying densities and noise: Identifies clusters in regions of high density and labels sparse points as noise, making it robust in non-uniform datasets. For example, in geospatial analysis, HDBSCAN detects dense urban areas and filters out noise from isolated, sparsely populated rural locations.
- Creates hierarchical clusters, allowing multiple levels of analysis: Builds a hierarchy of clusters, enabling users to view data at different levels of granularity for deeper insights. For example, in market research, HDBSCAN allows analysts to study customer behavior by breaking down clusters by regions, product categories, or spending habits for granular insights.
- Well-suited for anomaly detection in large datasets: Detects anomalies by isolating low-density points that do not fit into any cluster, making it ideal for identifying outliers in complex data. For example, in fraud detection, HDBSCAN identifies outliers in financial transaction data, flagging unusual activity that deviates from typical spending patterns.
Unlock your potential with upGrad's Post Graduate Diploma in Machine Learning. Gain expertise in ML, Generative AI, and statistics. By the end of the program, you will be proficient in designing, developing, and deploying ML models for applications across various industries.
Also Read: Top 10 Machine Learning Applications in 2025 and the Role of Edge Computing
Key Parameters of the HDBSCAN Algorithm
HDBSCAN has several key parameters that control its behavior and the quality of clustering. They can influence how clusters are formed, how noise is handled, and the granularity of the results.
Below are the main parameters and their significance:
- min_cluster_size:
Specifies the minimum number of points required to form a cluster. Points that don't meet this threshold are classified as noise. Decreasing this value allows smaller clusters to form, making the algorithm more sensitive and capable of identifying smaller groups within the data. However, it might also lead to overfitting, where too many tiny, irrelevant clusters are formed. Increasing min_cluster_size results in fewer, larger clusters and reduces the sensitivity to small, potentially unimportant groupings. This can help in identifying larger, more stable clusters but may exclude smaller patterns that could be important in some datasets.
- min_samples:
Defines the minimum number of neighboring points that a data point must have to be considered a core point. Core points are central to the formation of clusters. Higher values make the algorithm stricter in defining clusters, which can help eliminate noisy or spurious clusters by requiring more points to form a dense region. However, if this value is too high, it may fail to identify smaller, valid clusters. Lower values make the algorithm more flexible, potentially leading to more clusters, but possibly including more noise or less meaningful groupings.
- Metric:
Specifies the method for measuring the distance between points. Common options include Euclidean distance, which calculates the straight-line distance between two points, and Manhattan distance, which measures distance along axes at right angles (grid-based). The choice of metric impacts how clusters are defined and can significantly affect the algorithm's performance.
For example, Euclidean distance works well for continuous, spatial data, while Manhattan distance is often better suited for grid-like or non-continuous data. A custom metric can be used when domain-specific relationships between points need to be considered, such as in text or categorical data clustering.
- Cluster_selection_method:
Determines how clusters are selected from the hierarchical tree. There are two main methods:
- eom (Excess of Mass): This method focuses on the stability of clusters, selecting those that are most persistent and well-defined across different scales of the tree. It tends to produce clusters that are stable and robust but may ignore finer, less stable groupings that could still be meaningful in some contexts.
- leaf: This method selects clusters based on the leaves of the hierarchical tree, which represent the finest level of granularity. It can result in more clusters, some of which may be less stable but could capture finer details in the data. The choice between these methods depends on the level of granularity desired in the clustering.
- alpha:
Controls the level of detail in the clustering hierarchy. A smaller alpha value leads to finer clusters, making the algorithm more sensitive to small variations in density. This can result in a more detailed and intricate cluster structure, but it may also create a lot of small, potentially irrelevant clusters.
A larger alpha value reduces the detail, grouping points into broader clusters, and is useful when looking for more general trends in the data. Tuning this parameter helps strike a balance between precision and the ability to capture broader, overarching structures.
- p:
Used with the Minkowski distance formula, which generalizes both Euclidean (p=2) and Manhattan (p=1) distances. The value of p defines the power parameter in the Minkowski formula:
- For p=2, the distance becomes Euclidean, which works well when the data lies in a continuous space with standard distance metrics.
- For p=1, the distance becomes Manhattan, which is suited for data that follows grid-like patterns, such as in certain urban planning or digital image analysis tasks.
- Other values of p allow for more flexible distance metrics depending on the problem, offering more control over how distances between points are computed and thus affecting how clusters are formed.
Each of these parameters significantly impacts how the algorithm processes data, determines clusters, and identifies noise.
Are you a full-stack developer wanting to integrate AI into Python programming workflow? upGrad’s AI-Driven Full-Stack Development bootcamp can help you. You’ll learn how to build AI-powered software using OpenAI, GitHub Copilot, Bolt AI & more.
Also Read: Time Series Forecasting with ARIMA Models: Components, Advantages & Steps
Working Mechanism of the HDBSCAN Algorithm
HDBSCAN (Hierarchical Density-Based Spatial Clustering of Applications with Noise) is a clustering algorithm that works by building a hierarchy of clusters based on the density distribution of data points. It creates a mutual-reachability graph, where points are connected based on their similarity or distance.
The algorithm then uses this graph to identify clusters of varying densities, making it highly adaptable to complex datasets. Unlike traditional clustering methods, HDBSCAN does not require users to define the number of clusters beforehand, allowing for a more flexible clustering process.
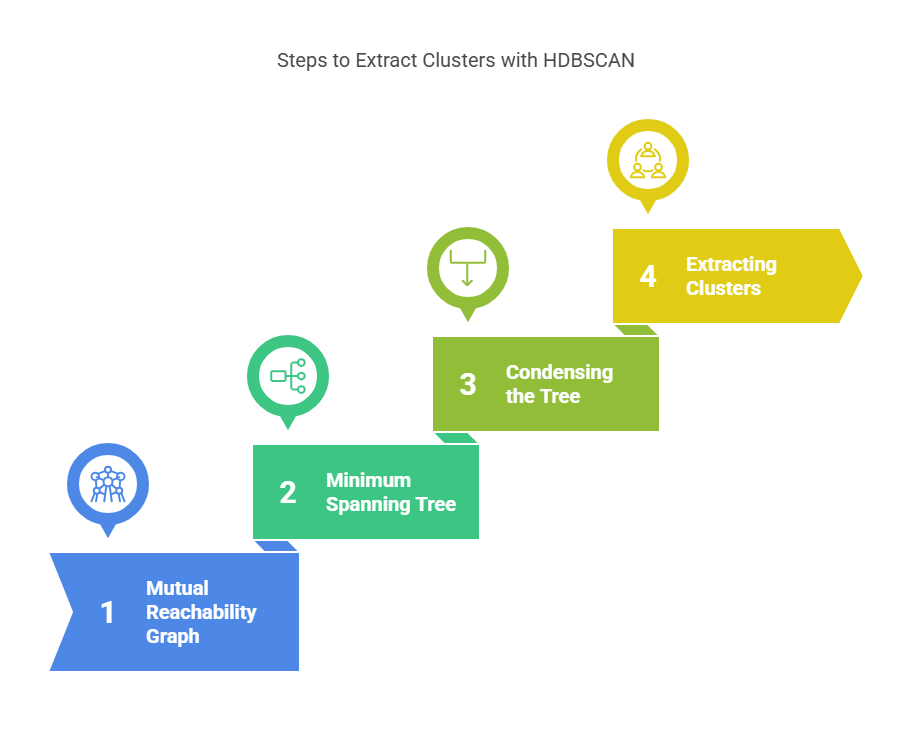
Step 1. Mutual Reachability Graph Construction
The first step in HDBSCAN is constructing a mutual-reachability graph. This graph connects data points based on a special distance measure that accounts for local density. The algorithm treats points in denser regions as being closer together and creates a graph where points are connected by edges weighted by this measure.
Here’s a closer look at the key elements involved in this process:
- Density-based distance: The algorithm calculates a special distance between each pair of points that accounts for local density (called mutual reachability distance). Points in crowded areas (high density) are treated as effectively closer together using this measure.
- Graph of points: It then builds a graph where each data point is a node and every pair of points is connected by an edge weighted with this new distance. This graph shows how closely points can be connected when considering density, highlighting where data points form dense groups.
- Mutual reachability distance is defined as the maximum of the distance between the two points and the minimum density of any point along the path between them. This ensures that points in higher-density regions are closely connected, while points in sparser regions are more distanced.
Step 2. Building the Minimum Spanning Tree (MST)
After constructing the mutual-reachability graph, the next step in HDBSCAN is to create a Minimum Spanning Tree (MST). The algorithm connects all data points using the shortest possible connections based on the mutual reachability graph, forming a tree that links every point while minimizing the total edge weight.
Here’s a breakdown of how the MST plays a crucial role in cluster formation:
- The MST connects the nodes with the smallest total edge weight, essentially grouping the points into hierarchical clusters based on their proximity and density.
- The leaves of the MST represent individual data points, while internal nodes correspond to potential clusters.
- The MST acts like a backbone of the cluster structure. Shorter edges in this tree connect points that are very close together, while longer edges bridge more distant groups of points.
This step ensures that the algorithm groups points with similar density, creating a structure where clusters can be identified at different levels of granularity.
Step 3. Condensing the Tree
Once the Minimum Spanning Tree (MST) is built, HDBSCAN proceeds to condense the tree by removing the longest edges, which represent weak connections. This step gradually breaks the tree into smaller, more meaningful clusters, allowing the algorithm to identify stable structures while filtering out noise.
Here’s how the process works:
- The condensed tree retains only the internal nodes and removes low-density points that don't belong to any cluster. Many tiny or short-lived clusters can appear during this process.
- The algorithm discards clusters that don’t have enough points or only exist briefly, leaving a condensed cluster tree with only the meaningful, more stable clusters.
This process isolates the most stable and meaningful clusters while filtering out noise and irrelevant data points.
Step 4. Extracting Clusters
After condensing the tree, the next step in HDBSCAN is to extract clusters by cutting the tree at a certain level. The cut level is determined based on either a user-defined minimum cluster size or a stability-based heuristic, ensuring that the most stable and meaningful clusters are selected. Here’s how the process works:
- Selecting stable groups: HDBSCAN identifies clusters that remain consistent across a wide range of tree-cutting levels. These persistent groups are considered the most stable and are selected as the final clusters.
- Final clusters and noise: The clusters that survive this stability check are output as the results of the algorithm. Any data points that don’t consistently belong to a stable cluster are classified as noise (outliers), meaning they are excluded from any cluster.
With the extraction process complete, the final clusters are identified, leaving us with a clear distinction between meaningful groupings and noise. Next, let’s explore how this process can be implemented in Python with a practical example.
If you want to understand how to work with AI and ML, upGrad’s Executive Diploma in Machine Learning and AI can help you. With a strong hands-on approach, this AI ML program ensures that you apply theoretical knowledge to practical problems.
Also Read: Exponential Smoothing Method in Forecasting: Techniques and Applications
How to Implement HDBSCAN Algorithm?
Implementing the HDBSCAN algorithm involves several steps, from installation to running the algorithm and visualizing the results. This section will guide you through the process in a way that is easy to follow, and we will include how to use both the HDBSCAN and related libraries, like Scikit-learn to facilitate the clustering process.
Note: You do not need different libraries for each step of the HDBSCAN algorithm itself-clustering can be fully performed using just the “hdbscan library5”. However, additional libraries are commonly used for tasks surrounding clustering |
Step 1: Install Required Libraries
To get started, install the HDBSCAN library along with supporting libraries. For the purpose of this implementation, you only need to install HDBSCAN along with scikit-learn for data manipulation and matplotlib for visualization. You can install them using pip:
pip install hdbscan
pip install scikit-learn
pip install matplotlib
Once installed, you can use HDBSCAN to perform clustering tasks directly. Other libraries like scikit-learn are optional and can be integrated for specific tasks, such as creating synthetic datasets or standardizing the data.
- hdbscan: Performs the clustering algorithm, including prediction and extracting cluster labels.
- pandas: Used for data management and manipulation; optional but helpful for handling datasets.
- matplotlib: Used for visualizing clusters; not required for clustering, but useful for plotting results.
- scikit-learn: Useful for generating synthetic datasets and preprocessing, but not required for running HDBSCAN itself.
Step 2: Import Libraries
Now that the libraries are installed, import the necessary packages to perform clustering and visualize the results.
import hdbscan
import pandas as pd
import matplotlib.pyplot as plt
from sklearn.datasets import make_blobs
from sklearn.preprocessing import StandardScaler
In this step, we import:
- hdbscan: For clustering data.
- pandas: For data management (optional for other datasets).
- matplotlib: For plotting clusters.
- scikit-learn: For generating synthetic datasets and preprocessing data.
Step 3: Prepare the Data
Preparing your dataset is essential before applying the HDBSCAN algorithm. This may involve normalizing or scaling the data or generating a synthetic dataset for testing purposes.
# Generate synthetic data
X, _ = make_blobs(n_samples=200, centers=5, cluster_std=0.60, random_state=0)
X = StandardScaler().fit_transform(X)  # Standardize data
In this example:
- make_blobs generates a random dataset of 200 data points with 5 centers.
- StandardScaler is used to standardize the data, which is generally recommended for clustering algorithms.
Step 4: Apply the HDBSCAN Algorithm
Now, apply the HDBSCAN algorithm to the dataset. You can adjust key parameters like min_cluster_size and min_samples to tune the algorithm’s sensitivity to clusters.
# Create HDBSCAN model
hdb = hdbscan.HDBSCAN(min_cluster_size=10, min_samples=5)

# Fit the model
hdb.fit(X)
What the Parameters Mean:
- min_cluster_size: The minimum number of points required to form a cluster.
- min_samples: Controls the sensitivity to noise. Higher values make the model stricter in assigning points to clusters.
Understanding the Output Labels:
After fitting the model, you can access the cluster assignments using hdb.labels_.
- Each data point is assigned a cluster label (e.g., 0, 1, 2, ...).
- Points with the label -1 are classified as noise, meaning they don’t belong to any dense region or cluster.
For instance, in customer segmentation:
- Label 0, 1, 2... = customer groups with similar behavior.
- Label -1 = outliers like one-time buyers or customers with unpredictable patterns.
To visually interpret the result, move to the next step—visualizing the clusters.
Step 5: Visualize the Clusters
After the model is trained, visualize the resulting clusters using matplotlib. Each point is colored according to its assigned cluster, with -1 representing noise.
# Plotting the clusters
plt.scatter(X[:, 0], X[:, 1], c=hdb.labels_, cmap='viridis', marker='o')
plt.title("HDBSCAN Clustering")
plt.show()
This code will generate a scatter plot where each data point is color-coded according to the cluster it belongs to. Points labeled -1 are treated as noise and shown in a distinct color.
Step 6: Analyze the Results
Once clustering is complete, you can analyze the results by examining the labels_ attribute of the HDBSCAN model. The labels_ array contains the cluster assignments for each data point.
# Print the number of clusters
print("Number of clusters:", len(set(hdb.labels_)) - (1 if -1 in hdb.labels_ else 0))

# Print noise points count
print("Number of noise points:", list(hdb.labels_).count(-1))
- len(set(hdb.labels_)): Counts the total number of clusters (excluding noise).
- list(hdb.labels_).count(-1): Displays the number of noise points (data points that don't belong to any cluster). For example, In customer segmentation for e-commerce, HDBSCAN labels one-time buyers or customers with unusual purchasing patterns as noise points (-1), indicating they don't fit into any of the main clusters.
Step 7: Fine-tuning Parameters
You can fine-tune the HDBSCAN algorithm to achieve better clustering by adjusting parameters like min_cluster_size and min_samples based on the characteristics of your data.
# Experiment with different parameters
hdb = hdbscan.HDBSCAN(min_cluster_size=20, min_samples=10)
hdb.fit(X)

# Visualize the results again
plt.scatter(X[:, 0], X[:, 1], c=hdb.labels_, cmap='viridis', marker='o')
plt.title("HDBSCAN Clustering - Adjusted Parameters")
plt.show()
Adjusting min_cluster_size and min_samples will change the sensitivity of the algorithm to density, resulting in more or fewer clusters depending on the settings.
Practical Example: Clustering Synthetic Data Using HDBSCAN
In this example, we apply HDBSCAN to cluster customer data based on purchasing behavior, helping an e-commerce company segment customers into meaningful groups. The algorithm will detect clusters of customers with similar buying patterns, while also identifying noise points as outliers (e.g., one-time buyers).
This can help the company better understand its customer base and target marketing efforts more effectively.
import hdbscan
import matplotlib.pyplot as plt
from sklearn.datasets import make_blobs
From sklearn.preprocessing import StandardScaler

# Step 1: Generate synthetic customer purchase data (for illustration)
X, _ = make_blobs(n_samples=500, centers=4, cluster_std=0.8, random_state=42)
X = StandardScaler().fit_transform(X)  # Standardizing the data

# Step 2: Apply the HDBSCAN algorithm
hdb = hdbscan.HDBSCAN(min_cluster_size=30, min_samples=5)
hdb.fit(X)

# Step 3: Visualize the clusters
plt.figure(figsize=(8, 6))
plt.scatter(X[:, 0], X[:, 1], c=hdb.labels_, cmap='coolwarm', marker='o', s=50)
plt.title("HDBSCAN Customer Segmentation")
plt.xlabel("Feature 1 (e.g., frequency of purchases)")
plt.ylabel("Feature 2 (e.g., total spending)")
plt.colorbar(label='Cluster Label')
plt.show()

# Step 4: Analyze the results
num_clusters = len(set(hdb.labels_)) - (1 if -1 in hdb.labels_ else 0)
num_noise_points = list(hdb.labels_).count(-1)

num_clusters, num_noise_points  # Show the results
Explanation:
- Step 1: We generate synthetic customer data using make_blobs with 500 samples, simulating customer purchase behavior (like frequency of purchases and total spending).
- Step 2: We apply the HDBSCAN algorithm with parameters min_cluster_size=30 and min_samples=5. This configuration means the algorithm will require at least 30 points to form a cluster and needs 5 neighboring points for each point to be considered a core point.
- Step 3: The matplotlib visualization displays the clusters formed by HDBSCAN. Each customer is color-coded according to the cluster it belongs to, with outliers marked as noise (labeled as -1).
- Step 4: We analyze the results by counting how many clusters were formed and how many points were classified as noise (outliers).
Output:
- Number of clusters: 4
- Number of noise points: 10
Explanation of Output:
- The algorithm identifies 4 distinct customer segments based on purchasing behavior.
- 10 customers are classified as noise (outliers), which could represent one-time buyers or customers with highly irregular purchasing patterns that don't fit into the typical groups.
In this practical example, HDBSCAN helps identify customer segments for targeted marketing or personalized offers, while noise points may represent anomalies or users who need separate analysis.
Also Read: Hierarchical Clustering in Python [Concepts and Analysis]
Optional preprocessing or dimensionality reduction (e.g., PCA, t-SNE) in HDBSCAN
Preprocessing techniques like PCA, t-SNE, or UMAP can be used before applying HDBSCAN to reduce the data's dimensionality. This is particularly useful for reducing the curse of dimensionality for high-dimensional data, which can be noisy and computationally expensive to cluster.
Why Use It?
- Reduces the impact of noise and irrelevant features.
- Improves clustering efficiency and speed, especially for large datasets.
How is It Done?
- Apply PCA, UMAP, or t-SNE to reduce dimensions.
- Use the transformed data as input to HDBSCAN.
It’s optional. However, it’s recommended for high-dimensional datasets to improve cluster quality and computational performance. By reducing dimensions, clustering becomes more efficient and effective, making it a beneficial step in many cases.
Now that you have a better understanding of how to implement HDBSCAN Clustering in Python, Let’s look into some practical use cases of HDBSCAN clustering in real life.
If you need a better understanding of cybersecurity, upGrad’s free Fundamentals of Cybersecurity course can help you. You will learn key concepts, current challenges, and important terminology to protect systems and data.
Also Read: Image Segmentation Techniques [Step By Step Implementation]
Use Cases of HDBSCAN Clustering in Real Life

HDBSCAN is increasingly used in real-life applications where identifying clusters of varying densities is essential. Its ability to automatically detect clusters without predefining their number makes it ideal for dynamic and complex datasets. From anomaly detection to customer segmentation, HDBSCAN provides valuable insights in various industries.
1. Industrial Process Monitoring
HDBSCAN is a valuable tool for industrial process monitoring, allowing for the identification of abnormal patterns or outliers in real-time data. By clustering sensor data from machines or production lines, HDBSCAN can quickly detect faults or inefficiencies, leading to better decision-making and predictive maintenance.
- Anomaly Detection: HDBSCAN can identify unusual behavior or deviations in sensor data, flagging potential failures early.
- Predictive Maintenance: By clustering sensor data over time, it helps predict when equipment may require maintenance, reducing downtime.
- Real-Time Monitoring: HDBSCAN supports real-time data analysis, allowing for immediate detection of issues in the production process.
2. Fraud Detection
HDBSCAN plays a crucial role in fraud detection by identifying unusual patterns in transactional data. It helps to detect anomalous behaviors, such as fraudulent transactions, by clustering data points with similar characteristics and flagging outliers. Since fraud patterns can vary in density and structure, HDBSCAN’s ability to adapt to these variations makes it ideal for detecting subtle fraudulent activities.
- Anomaly Detection: HDBSCAN identifies transactions that deviate from normal patterns, such as a sudden large withdrawal from an account, marking them as potential fraud for further investigation.
- Dynamic Detection: It can detect fraud across varying patterns and densities, such as new types of payment fraud or irregular spending behaviors, adapting to evolving fraud tactics over time.
- Noise Filtering: By labeling unusual data points as noise, such as a legitimate but rare transaction, HDBSCAN reduces false positives and improves the accuracy of fraud detection by focusing on true anomalies.
3. Spatial Data Analysis
HDBSCAN is highly effective in spatial data analysis, where it helps identify clusters in geospatial data with varying densities. By clustering geographic locations based on proximity and other spatial features, HDBSCAN can uncover patterns such as areas of high activity or underutilized zones. Its ability to handle noise and irregular shapes makes it suitable for complex spatial datasets, including urban planning and environmental monitoring.
- Geospatial Pattern Recognition: HDBSCAN can identify regions with high concentrations of activity, such as popular tourist spots or business hubs, based on location data.
- Urban Planning: It helps in identifying underutilized or overpopulated areas by clustering locations with similar characteristics, guiding resource allocation and infrastructure development.
- Environmental Monitoring: By analyzing spatial data from sensors, HDBSCAN detects unusual patterns, such as environmental anomalies or pollution hotspots, helping in timely intervention and management.
4. Genomics
HDBSCAN is valuable in genomics for clustering genetic data, such as gene expression levels or genetic variations, which often exhibit complex, non-linear relationships. It helps in identifying subgroups within genetic datasets, such as patient populations with similar genetic profiles, without requiring a predefined number of clusters.
- Gene Expression Clustering: HDBSCAN can group genes with similar expression patterns, helping identify biomarkers or gene functions related to specific diseases.
- Genetic Variation Analysis: It detects clusters of individuals with similar genetic variants, revealing patterns that could contribute to disease susceptibility or resistance.
- Handling High-Dimensional Data: HDBSCAN effectively clusters complex, high-dimensional genomic data, identifying meaningful patterns while reducing the impact of noise in large datasets.
5. Market Segmentation
HDBSCAN is highly effective in market segmentation by clustering customers based on purchasing behavior, demographics, and other factors. It helps identify distinct customer segments, making it ideal for dynamic and evolving markets. It ensures that both large and niche customer segments are accurately identified.
- Customer Behavior Grouping: HDBSCAN clusters customers with similar purchasing patterns, helping businesses tailor marketing strategies to specific segments, such as frequent buyers or seasonal shoppers.
- Targeted Campaigns: By identifying unique segments, HDBSCAN enables businesses to create personalized campaigns for high-value customers or under-served markets.
- Dynamic Segmentation: It adapts to changing market conditions, detecting emerging trends or shifts in customer preferences, ensuring that segmentation remains relevant over time.
Now that you have a better understanding of how to implement HDBSCAN Clustering in Python, let’s look at some of its advantages and drawbacks.
Advantages & Limitations of HDBSCAN Algorithm
HDBSCAN offers significant advantages, such as its ability to handle clusters of varying densities, manage noise, and not require pre-defined cluster counts. However, it also has limitations, including sensitivity to parameters and higher computational complexity compared to simpler algorithms like k-means.
Below is a table that explores both the strengths and challenges of using HDBSCAN.
Advantages | Limitations |
Automatically detects the optimal number of clusters, reducing the need for user input. | Can be computationally expensive, especially for large datasets due to the MST construction. |
Handles data with varying densities, identifying clusters with different shapes. | Struggles with high-dimensional data, as the clustering effectiveness decreases with more features. |
Labels noise points separately, improving the clustering quality and focusing on meaningful clusters. | Sensitive to parameter tuning, especially **min_cluster_size** and **min_samples**, affecting clustering quality. |
To get the most out of HDBSCAN clustering, consider the following best practices:
- Experiment with min_cluster_size: Adjust this parameter to control the minimum cluster size, ensuring meaningful groups without merging noise points.
- Standardize your data: Scale features to ensure that all data dimensions contribute equally, preventing dominant features from skewing the clustering process.
- Use dimensionality reduction: Apply PCA or UMAP to reduce high-dimensional data, making clustering more efficient and accurate.
- Visualize results: Plot clusters using 2D/3D visualization techniques to better understand the structure of your data and detect potential noise.
- Evaluate with external metrics: Use metrics like Silhouette Score to assess cluster quality and adjust parameters to optimize performance.
Also Read: Top 10 Dimensionality Reduction Techniques for Machine Learning(ML) in 2025
Test your understanding of HDBSCAN Clustering in machine learning with a quizz. This will help reinforce the concepts covered in the tutorial and prepare you for practical application.
Take a Quiz & Test Your Knowledge in HDBSCAN in ML
Assess your understanding of HDBSCAN Clustering, its parameters, advantages, limitations, and best practices by answering the following multiple-choice questions.
Test your knowledge now!
1. What is the effect of increasing the min_cluster_size parameter in HDBSCAN?
a) It reduces the number of clusters by requiring larger clusters to be formed
b) It increases the number of clusters by allowing smaller clusters
c) It makes the algorithm more sensitive to noise
d) It makes the clustering process faster
2. In HDBSCAN, what does the min_cluster_size parameter control?
a) The maximum allowed distance between data points
b) The minimum number of points required to form a cluster
c) The density of points in each cluster
d) The number of outliers in the data
3. What is the role of the mutual-reachability distance in HDBSCAN?
a) It measures the Euclidean distance between points
b) It calculates the density difference between points
c) It defines the proximity between points based on density and distance
d) It measures the correlation between different clusters
4. Which of the following is a limitation of HDBSCAN?
a) It requires the number of clusters to be defined beforehand
b) It can’t handle high-dimensional data
c) It can be computationally expensive for very large datasets
d) It cannot handle noise or outliers
5. How does HDBSCAN handle noise and outliers in a dataset?
a) Noise points are assigned to the nearest cluster
b) It labels points that do not fit into any cluster as noise (label -1)
c) It excludes noisy data points from the dataset completely
d) Noise points are automatically removed from the data
6. What is the function of the condensed tree in HDBSCAN?
a) It visualizes the data points' distribution
b) It simplifies the hierarchical structure to focus on stable clusters
c) It automatically determines the number of clusters
d) It calculates the core distances of all data points
7. Which of the following techniques can be used to improve HDBSCAN's performance on high-dimensional data?
a) Increasing the number of clusters
b) Using dimensionality reduction techniques like PCA or UMAP
c) Using k-means for initial clustering
d) Predefining the noise threshold
8. What does the min_samples parameter influence in HDBSCAN?
a) The minimum number of points needed for a core point
b) The maximum allowed number of points in a cluster
c) The size of the minimum spanning tree
d) The number of outliers to be detected
9. Which of the following is a typical use case of HDBSCAN?
a) Clustering highly structured data with fixed boundaries
b) Identifying clusters in data with varying densities, such as customer segmentation
c) Clustering data that has well-separated groups
d) Data with known predefined clusters
10. How can you evaluate the quality of clusters produced by HDBSCAN?
a) By counting the number of clusters
b) By visualizing clusters and assessing silhouette scores
c) By measuring the distance between clusters only
d) By calculating the density of individual data points
You can also continue expanding your skills in machine learning with upGrad, which will help you deepen your understanding of advanced ML concepts and practical applications.
How upGrad Helps You Stay Ahead with Industry Trends?
HDBSCAN clustering is a powerful technique used in machine learning and data analysis to group data points based on varying densities, uncovering hidden patterns and outliers. It plays a critical role in applications like anomaly detection and customer segmentation. Are you worried about understanding machine learning algorithms? upGrad can help you upskill and master complex algorithms and concepts of ML and data science, enhancing practical skills and facilitating career advancement.
upGrad offers online courses, live classes, and mentorship to help you excel in machine learning. With 10 million learners, 200+ programs, and 1,400+ hiring partners. upGrad offers comprehensive mentorship programs, interactive workshops, and hands-on projects that enable learners to apply theoretical knowledge in real-world scenarios.
While the course covered in the tutorial can significantly improve your knowledge, here are some free courses to facilitate your continued learning:
- Hypothesis Testing
- Unsupervised Learning: Clustering
- Logistic Regression for Beginners
- Linear Regression - Step by Step Guide
- Introduction to Natural Language Processing
You can also get personalized career counseling with upGrad to guide your career path, or visit your nearest upGrad center and start hands-on training today!
Similar Reads:
- Q Learning
- Bagging in Machine Learning: Overview, Steps, Benefits & Applications
- Cost Function In Machine Learning
- Bootstrap Aggregation
- Mahalanobis Distance: Formula, Python Code, Applications & Best Practices
FAQs
1. How does HDBSCAN differ from DBSCAN in clustering?
HDBSCAN improves upon DBSCAN by allowing variable density clusters and not requiring a fixed eps parameter. Unlike DBSCAN, HDBSCAN automatically finds the number of clusters and can handle hierarchical relationships. Additionally, it uses a mutual-reachability graph to connect points based on both distance and density, providing more flexibility in identifying clusters of varying sizes and shapes.
2. How can I tune the parameters of HDBSCAN for optimal clustering?
Key parameters to tune in HDBSCAN include min_cluster_size and min_samples. min_cluster_size controls the smallest allowable cluster size, while min_samples affects the density threshold needed for a core point. You can experiment with different values and use metrics like the Silhouette Score to evaluate cluster quality and fine-tune these parameters for your specific dataset.
3. How does HDBSCAN perform in unsupervised learning tasks compared to supervised methods?
HDBSCAN is an unsupervised clustering algorithm that is particularly effective when you don't have labeled data or predefined groups. Unlike supervised methods, which rely on labeled data to predict or classify data points, HDBSCAN discovers hidden patterns based on the natural structure of the data. Its ability to detect noise and varying densities gives it a significant advantage in complex, unlabeled datasets.
4. How does HDBSCAN handle noise and outliers in datasets?
HDBSCAN automatically classifies points that don't fit into any clusters as noise (labeled as -1). By focusing on core points and eliminating sparse data points, it reduces the impact of outliers on clustering results. This feature ensures that the clustering process remains robust, especially in datasets with irregular or noisy points.
5. Can HDBSCAN be used for time-series data analysis?
Yes, HDBSCAN can be applied to time-series data for anomaly detection or clustering. By analyzing time-series data points in terms of their similarity and density over time, it can identify trends, seasonal patterns, and outliers in temporal datasets. However, preprocessing steps like smoothing or normalization are essential to ensure the algorithm identifies meaningful temporal patterns
6. Can HDBSCAN be used for high-dimensional data?
Yes, HDBSCAN can handle high-dimensional data, but like other clustering algorithms, its performance may degrade with increasing dimensions due to the "curse of dimensionality." Applying dimensionality reduction techniques like PCA or UMAP before clustering can improve its effectiveness by reducing noise and making the clustering process more efficient.
7. How does HDBSCAN work with hierarchical clustering?
HDBSCAN builds a hierarchical tree of clusters, where each branch represents a potential cluster. It then condenses this tree, retaining only the most stable clusters, and allows users to select the final clusters based on cluster stability. This hierarchical approach enables the algorithm to detect clusters at multiple levels of granularity, providing more flexibility than flat clustering methods.
8. Can HDBSCAN be used for anomaly detection in real-time data?
Yes, HDBSCAN can be used for real-time anomaly detection. It continuously clusters incoming data and flags points that do not belong to any cluster as anomalies (noise). In applications like network security or fraud detection, HDBSCAN can detect unusual activities or outliers in real time, alerting users to potential issues immediately.
9. What are the limitations of HDBSCAN in machine learning applications?
Despite its strengths, HDBSCAN can be computationally expensive for very large datasets due to the need to build a minimum spanning tree and hierarchical clustering structure. It also struggles with datasets where the density varies significantly, leading to possible misidentification of clusters. Moreover, parameter sensitivity, particularly with min_samples and min_cluster_size, can impact the clustering quality if not properly tuned.
10. How does HDBSCAN handle imbalanced datasets?
HDBSCAN can handle imbalanced datasets by detecting clusters of varying densities. The min_cluster_size and min_samples parameters help control how clusters of different sizes are treated. It can effectively identify small but significant clusters in imbalanced data, which traditional methods like k-means may overlook, making it ideal for imbalanced classification tasks.
11. How do you visualize the clusters created by HDBSCAN in high-dimensional data?
For high-dimensional data, t-SNE or UMAP can be used for dimensionality reduction to map the clusters into 2D or 3D space. Once reduced to a lower-dimensional representation, you can visualize the clusters identified by HDBSCAN using scatter plots, with points color-coded by their cluster label. This allows for a more intuitive understanding of the clustering structure.


upGrad Learner Support
Talk to our experts. We are available 7 days a week, 10 AM to 7 PM
Indian Nationals
Foreign Nationals
Disclaimer
The above statistics depend on various factors and individual results may vary. Past performance is no guarantee of future results.
The student assumes full responsibility for all expenses associated with visas, travel, & related costs. upGrad does not .