
Imagine taking a medical diagnostic test, and your report returns positive for a disease! You are going through immense emotional upheaval when the diagnostic lab gets in touch to say that the results were wrong! All of this distress because their diagnostic tool was inaccurate. If only someone had tested the model’s performance.
Simply developing a model and implementing it is not enough. How good is it at its job? Is the model accurate and effective? So how do you answer these questions? Receiver Operating Characteristic (ROC) curve is a graphic metric used to measure the performance of binary classification models. Performance metrics and datasets like the ROC curve are critical in assessing machine learning models post-implementation to know how well they work.
Enrol for the Machine Learning Course from the World’s top Universities. Earn Masters, Executive PGP, or Advanced Certificate Programs to fast-track your career.
Is your curiosity piqued? Are you wondering, “What is the role of ROC curve in machine learning?” Do you want to put your model to the test? We’ll get you started on the right track. Let’s begin by answering the most basic question- What is ROC curve?

What is ROC Curve?
The ROC curve, short for Receiving Operating Characteristic curve, is a graphical tool that represents the performance of binary classification models across various classification threshold settings. Tracing its origins to World War II, the ROC analysis was developed to measure a military signal receiver’s ability to distinguish between objects of interest, like enemy bombers, against background noise. Since, the ROC curve has found application in fields such as medicine, psychology, radiology, meteorology, natural hazard forecasting, and more. Most recently, the application of the ROC curve in machine learning and data mining has become popular.
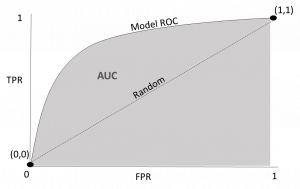
This probability graph plots two parameters- the true positive rate (TPR) opposite to the false positive rate (FPR) at varying classification threshold values. It distinguishes between the ‘signal’ and the ‘noise.’ While the TPR is plotted on the 𝑦-axis, the FPR is plotted on the 𝑥-axis of the ROC curve.
Having answered the question, “What is ROC curve?”, let’s turn toward another critical concept- the Area Under ROC curve (AUC).
What is Area Under ROC Curve?
The Area Under ROC curve (AUC) measures a classifier’s ability to make distinctions between classes across all threshold values. The AUC is used to summarise the ROC curve and covers the entire two-dimensional area under it on the graph. The higher the value of AUC for a particular classifier, the better its performance in distinguishing between negative and positive classes. Its value ranges between 0 and 1, meaning when the AUC is closer to 1 and more than 0.5, the classifier is more likely to detect the difference between positive and negative classes.
Terms used in AUC and ROC Curve
Apart from the ROC curve and AUC, there are several other terms that you should be aware of in relation to the ROC curve. We will break down some of the most critical ones.
1. True positive rate (TPR)
Also known as recall or sensitivity, the true positive rate is the proportion of positives that were classified correctly. It evaluates the model’s ability to predict true positives.
Its formula is:
TPR=TP/ TP + FN
where,
TP = true positive
FN = false negative
2. Specificity
It indicates the proportion of the negative class that was correctly classified. It evaluates the classifier’s ability to predict true negatives correctly.
Its formula is:
Specificity=TN/TN + FP
where,
TN = true negative
FP = false positive
3. False positive rate (FPR)
The false positive rate represents the proportion of negative classes the model classified incorrectly.
Its formula is:
FPR = 1- Specificity
4. True positive (TP)
Positive classes are predicted as positive by the classifier.
5. True negative (TN)
Negative classes that are correctly predicted as negative by the model.
6. False positive (FP)
It is a Type I classification error where a classifier incorrectly classifies a negative class as positive.
7. False negative (FN)
It is a Type II classification error where a classifier incorrectly predicts a positive class item as negative.
8. Threshold
It is the cut-off point for observations on the graph to be either classified as 0 or 1. In most cases, 0.5 is considered the standard threshold. Increasing or decreasing the threshold can alter the prediction outcomes of the analysis.
How to speculate the performance of the model?
In this section, we answer the most fundamental question: How does the AUC and ROC curve help us gauge the performance of a classifier model?
The value of AUC is an indicator of the performance of binary classifier models. It tells you whether your model works and how well it performs. Let’s look at the parameters of performance.
- An AUC value of 1 signifies a model that can accurately classify all positive and negative classes. An AUC value close to 1 indicates a good separability measure.
- When the AUC is 0.5, the model cannot distinguish between positive and negative classes. It demonstrates that the model is classifying a constant class or random class along all data points.
- When the AUC is 0, the classifier predicts positives as negatives and negatives as positives. The model is essentially inversing the results.
- So, when 0.5<AUC<1, the classifier system can detect more true negatives and positives against false negatives and positives. The model is more likely to distinguish between positive and negative classes.
The Relation Between Sensitivity, Specificity, FPR, and Threshold
We have already discussed the terms sensitivity, specificity, FPR, and threshold. But how are they related to each other? Let’s elaborate.
Below is an image of the confusion matrix. It is a tabular visual representation of the number of predicted and actual positive and negative classes. The columns represent the actual value, and the rows represent the predicted value.
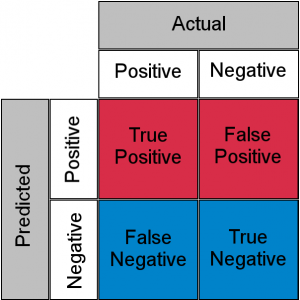
Sensitivity or the total positive rate (TPR) is calculated using the formula:
TPR=TP /TP + FN
So, sensitivity is measured using the true positive and false negative classes. It gives us the ratio of positive classes that have been identified correctly.
Specificity, on the other hand, is inversely proportional to sensitivity. It indicates the model’s ability to detect true negatives. Since the false positive rate (FPR) is the proportion of incorrectly predicted negative classes, it can be measured by the formula:
FPR = 1- Specificity
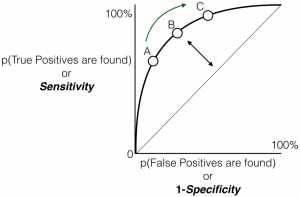
The threshold plays a crucial role in determining sensitivity, specificity, and FPR. Changing the threshold changes the number of positive and negative cases. It directly affects sensitivity and specificity, which have an inverse relation. Moreover, as it is directly related to specificity, a change in the threshold affects the FPR.
Therefore, it can lead to two scenarios.
- Increasing the threshold results in an increased number of negative values and fewer positive values. Consequently, it raises specificity and reduces sensitivity and FPR.
- Lowering the threshold results in an increased number of positive values and reduced negative values. So, sensitivity and FPR increase while specificity lowers.
How to Use the AUC – ROC Curve for the Multi-Class Model
In machine learning, a multi-class classification model is one where the model has to classify an item when more than two classes are available. How can the AUC-ROC curve navigate a multi-class rather than a binary model?
The answer is- the One vs All method. Simply put, if there are N number of classes, we plot N number of AUC-ROC curves. Let’s show you an example.
Suppose there are four classes- A, B, and C. You construct 3 ROC curves, where:
- A vs B and C
- B vs A and C
- C vs A and B
When each ROC curve emerges, given the value of AUC, you will be able to evaluate the performance of the multi-class model. However, given the multiple AUC-ROC curves that must be plotted depending on the number of classes, this method works best if applied to a model with a few classes.
Best Machine Learning and AI Courses Online
Conclusion
If you are an employee of an organisation, you must have undergone regular evaluations to measure your work performance. It keeps you on your toes and tells you where you can improve. In a similar vein, machine learning models also need to be evaluated to get a sense of their performance and effectiveness. The ROC curve in machine learning serves just this purpose!
It is an essential tool in testing binary classification models for their efficacy. Along with the Area under ROC curve, the ROC curve can tell you how right or wrong your classifier is in predicting negative and positive classes. Performance metrics, like the AUC-ROC curve, provide a safeguard from faulty classification models that can incur huge costs.
If this brief introduction on “What is ROC curve?” has awakened your interest, you might want to delve deeper into the thrilling world of machine learning and deep learning.
In-demand Machine Learning Skills
How our course would help you understand
With rapid advances and increasing application, it is an exciting time to build a career in machine learning and deep learning. Push your career in the right direction with upGrad’s Advanced Certificate Programme in Machine Learning and Deep Learning.
Learn in-demand skills with our comprehensive curriculum. Cover subjects like machine learning, deep learning, computer vision, and neural networks for in-depth knowledge of the field. Offered by IIIT Bangalore, the No. 1 Private Technical University in India, the 8-month course includes 1:1 career mentorship sessions.
Enrol now to fast-track your career today!
Popular AI and ML Blogs & Free Courses
You can also check out our free courses offered by upGrad in Management, Data Science, Machine Learning, Digital Marketing, and Technology. All of these courses have top-notch learning resources, weekly live lectures, industry assignments, and a certificate of course completion – all free of cost!


![15 Interesting MATLAB Project Ideas & Topics For Beginners [2024]](/__khugblog-next/image/?url=https%3A%2F%2Fd14b9ctw0m6fid.cloudfront.net%2Fugblog%2Fwp-content%2Fuploads%2F2020%2F05%2F561-metalab-projects.png&w=3840&q=75)