







.png)












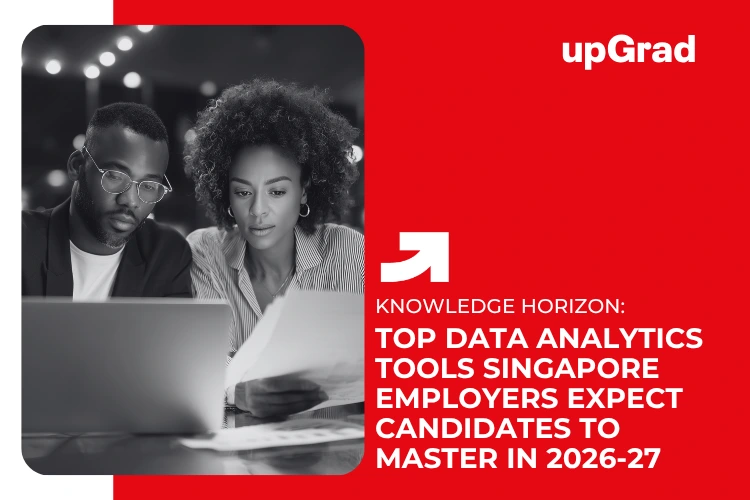
What does it take to stand out in Singapore’s data-driven job market in 2026-27? Knowing Excel or just one visualization platform is no longer enough. Singapore’s tech workforce grew 2.7% to 214,000 in 2024, while IMDA found that Python and SQL appeared in 24% and 20% of tech job postings, respectively. Power BI was also among the skills showing increased demand.
For aspiring data analysts and professionals looking to move into analytics, the right data analytics tools can make a practical difference. This guide covers the tools Singapore employers want, what each is used for, and which skills are worth prioritizing for 2026-27.
Source: IMDA
Data Analytics Tools Singapore Employers Value Most in 2026–27
Wondering which tools are actually worth learning for a data analytics career in Singapore? You don’t need to know every platform on the market. A practical toolkit starts with SQL and Excel, then moves to Python, Power BI or Tableau, databases, and cloud platforms. The best data analytics tools for you, though, depend on the type of role you’re targeting.
| Tool | What It Helps With | Common Use |
| SQL | Querying and working with data | Data analysis |
| Excel | Cleaning, calculations, and reporting | Finance and business |
| Python | Automation and advanced analysis | Data and analytics |
| Power BI | Dashboards and reports | Business intelligence |
| Tableau | Data visualization | Business reporting |
| Databases | Storing and managing data | Data management |
| Cloud platforms | Working with data at scale | Modern analytics |
Data Analytics Tools by Career Use Case and Skill Level
You don’t need to learn every analytics tool to be job-ready. The better approach is to understand what each one does and pick tools that match the work you want to do. SQL and Excel cover much of the day-to-day work , while Python, BI platforms, databases, and cloud tools come in as your role advances.
1. SQL for Data Extraction and Transformation
SQL helps analysts retrieve the right data from databases and make it usable. You’ll use it to filter records, combine tables, clean information, and prepare data for reports or further analysis.
- Best for: Data and business analysts
- Useful for: Queries, data extraction, and transformation
- Skill level: Beginner to advanced
2. Excel for Everyday Business Analysis
Excel is still handy for quick analysis and routine business work. It’s particularly useful when you need to review numbers, clean a spreadsheet, build a report, or work through a smaller dataset.
- Best for: Finance, operations, marketing, and business roles
- Useful for: Reports, calculations, forecasting, and quick analysis
- Skill level: Beginner to intermediate
Also Read: Top Computer Science Project Ideas for Singapore Tech Students in 2026
3. Python for Analysis and Automation
Python is worth adding when you want to do more with your data. It can handle repetitive tasks, work with larger datasets, and support more detailed analysis without requiring you to perform every step manually.
- Best for: Data analysts and data-focused professionals
- Useful for: Automation, data processing, visualization, and advanced analysis
- Skill level: Intermediate to advanced
4. Power BI and Tableau for Dashboards
Power BI and Tableau make it easier to turn raw analysis into something people can understand at a glance. Start with one and build confidence before spending time on the other.
| Tool | What It’s Good For | Common Use |
| Power BI | Business reporting | Dashboards and interactive reports |
| Tableau | Visual analysis | Dashboards and data storytelling |
5. Databases, Cloud and Analytics Engineering Tools
Databases and cloud platforms matter more as datasets and analytics workflows become larger. Depending on the role , you may encounter data warehouses, cloud services, or analytics engineering tools.
The right data analytics tools and techniques depend on the role you want. Check current job descriptions, learn the essentials first, and add new tools when they clearly support your career.
How to Build a Data Analytics Toolkit Employers Can Evaluate?
Learning a list of tools is one thing; demonstrating what you can do with them is another. A strong portfolio should make it easy for employers to see how you approached a real problem, worked with data, and arrived at a useful conclusion.
| Learning Stage | What To Build |
| SQL | Query and transform relational data |
| Excel/Sheets | Analyze |
| Power BI/ Tableau | Create an interactive dashboard |
| Python | Automate analysis or data cleaning |
| Statistics | Test assumptions and interpret results |
| Cloud/ Warehousing | Work with larger data workflows |
Also Read: What Is a Data Mesh Architecture and Why Are Singapore Enterprises Adopting It?
Build Job-Ready Data Analytics Skills With upGrad
Knowing a few data analytics tools is useful, but employers notice when and how you use them. For Singapore learners who prefer a structured way to build these skills, upGrad is one option to explore. Its learning pathways, available through university and industry partners, combine concepts with hands-on projects, helping learners move from practicing individual tools to applying analytics skills in real business situations.
Take some time out to explore these popular online programs through upGrad in Singapore:
- Master of Science in Data Science from Liverpool John Moores University
- Executive Diploma in Data Science and AI with IIIT-B
- Executive Post Graduate Certificate Programme in Data Science & AI from IIITB
🎓 Explore Our Top-Rated Courses in Singapore
Take the next step in your career with industry-relevant online courses designed for working professionals in Singapore.
- DBA Courses in Singapore
- Data Science Courses in Singapore
- MBA Courses in Singapore
- Master of Education Courses in Singapore
- AI ML Courses in Singapore
- Digital Marketing Courses in Singapore
- Product Management Courses in Singapore
- Generative AI Courses in Singapore
FAQs On Data Analytics Tools
Start with Excel if you’re new to data analytics. It’s easy to pick up and gives you a feel for formulas, sorting, filtering, pivot tables, and basic charts before you take on more advanced tools.
Not necessarily. Knowing one well can be enough to start. Power BI and Tableau both handle dashboards and data visualization, so start with one. Add the other later if your target roles call for it.
Python is usually the easier choice for a broader analytics career. It works well for data cleaning, analysis, visualization, and automation. Consider R when your work leans heavily toward statistics or research.
Excel, SQL, Power BI, Tableau, and Python are all useful in finance. Together, they can help you work with financial data, build reports, create dashboards, spot trends, and automate routine analysis.
Yes, upGrad offers learning options through its partner institutions and providers that can cover data analytics skills. Depending on the course, you may build skills in areas such as SQL, Python, visualization, and business intelligence.