


If you are not sure how to use if-else statements and loops in r, this article will help a lot. Whether you are programming in any other language, including R, you want to take control of how and when each part of the code is executed. This can be very easily done if you choose to use control structures such as if-else statements. In simpler terms, control structures are code blocks that help to manage the execution of the other code sections depending on stated parameters. These can be considered as instructions that parents give to their children before they go out of the house. For instance, “If I do not come home by 10 pm, go off to sleep.” A condition is set where the control structures instruct R about what should be done if the condition is not met or met. At all times, R will strictly follow the instructions given.
Comparison Operators in R
If you want to use control structures, the first thing that has to be done is creating statements that will either result in ‘False’ or ‘True’. In the aforementioned example of kids, the statement “It is 10 pm. Have my parents returned home?” yields False (No) or True (Yes). The best way to assess something as False or True in R is with the help of comparison operators. Mentioned below are a few comparison operators that are essential to work with control structures in R:
Here ‘==’ means equality. If the declaration x == a is outlined as a question, it means, “Is the value of x the same as the value of a?”
- ‘!=’ signifies “not equal to”. If the statement x != b is outlined as a question, it means, “Is the value of x not the same as the value of b?”
- ‘<’ signifies “less than”. If the statement x < c is outlined as a question, it symbolizes “Is x’s value less than c’s value?”
- ‘<=’ signifies “less than or equals to”. If the statement x <= d is outlined as a question, it symbolizes “Is x’s value less or the same as the value of d?”
- ‘>’ signifies “greater than”. If the declaration x > e is outlined as a question, it symbolizes “Is x’s value bigger than the value of e?”
- ‘>=’ signifies “greater than or equals to”. If the statement x >= f is outlined as a question, it means, “Is x’s value more than or equals to f’s value?”
Everything you need to know about If-Else in R
Explore our Popular Data Science Courses
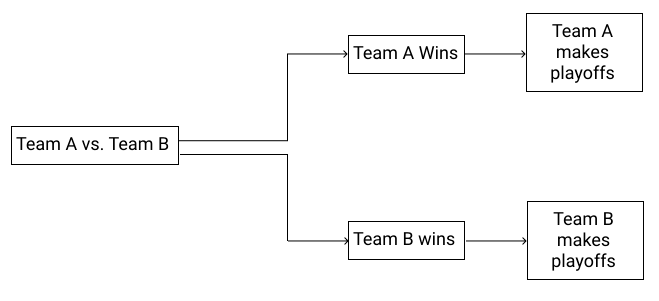
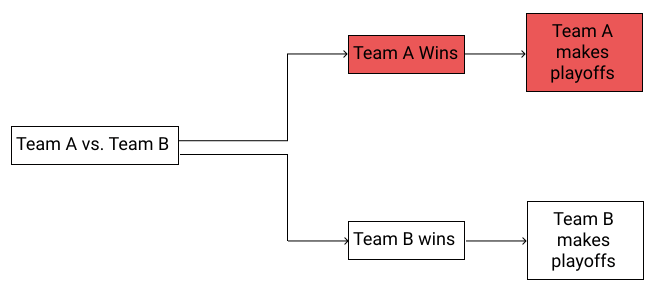
Suppose you are watching a match of cricket that determines the team that will make it to the playoffs. All possible outcomes can easily be visualized with the help of a tree chart:
Source Image: Google
With the help of the aforementioned tree chart, you can easily see that there are only 2 possible outcomes. In case Team A wins the match, they will reach the playoffs. On the other hand, Team B will reach the playoffs if it wins the match.
You can try representing this situation in R as well. An if statement can be used so that the program can be written that determines the winning team. R is instructed by if statements to run a code line if one of the conditions returns True. Considering an if statement in this situation is a better choice here. Depending on the outcome occurs, an if statement allows control of the statement that is printed.
Read our popular Data Science Articles
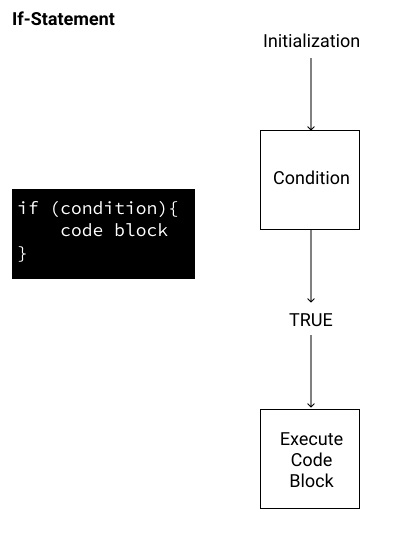
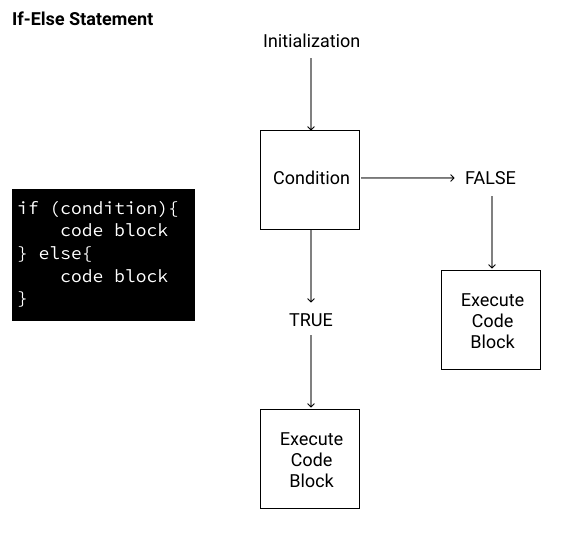
The basic syntax and conditional flow chart for an if statement is shown in the figure given below:
Source Image: Google
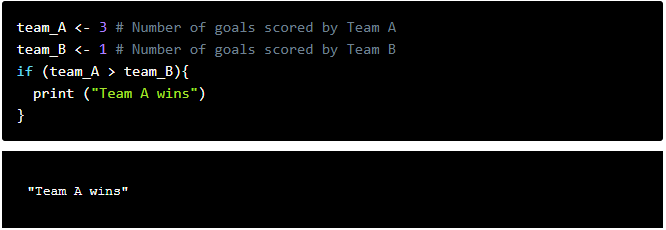
The condition in if statement has to be in a manner that it results in ‘False’ or ‘True’. In case the expression returns ‘True’, all code within the brackets { } will be executed by the program. On the other hand, code is executed by the program if the expression reverts ‘False’. Now, given below is an illustration of an if statement that will print the winner team’s name:
Source Image: Google
The program worked! As ‘Team A’ scored more goals compared to Team B, the conditional statement [team_A > team_B] results in ‘True’. Hence, the broadcast that Team A has won the game is printed.
Check Out upGrad’s Data Science Courses
Adding the else Statement in R
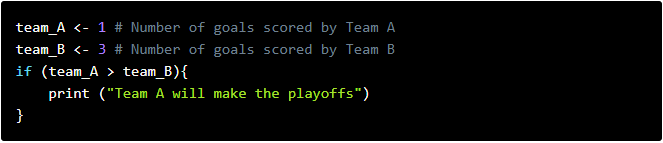
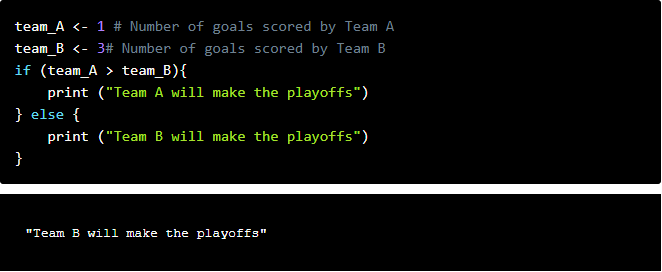
Previously, based on the expression, the team’s name that will make it to the playoffs was printed. Now, take a look at a different score matchup. What happens when Team B scores 3 goals and Team A scores 1 goal. The team_A > team_B conditional will result in ‘False’. Hence, nothing will be printed when the code runs. The is because when the if statement results in ‘False’, the block of code within the if statement will not be executed:
Source Image: Google
If you check the original flow chart, for one of the two probabilities, only one branch is coded:
Source Image: Google
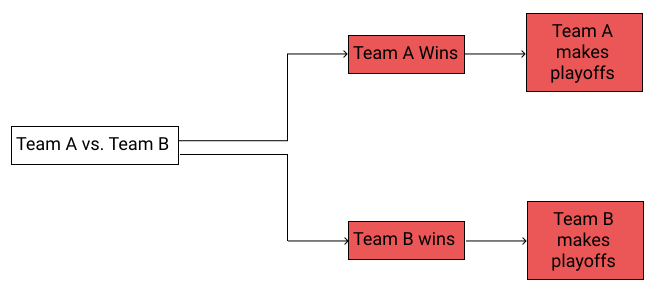
The program should be designed in a manner that accounts for both likelihoods. When the expression will evaluate to ‘False’, ‘Team B makes the playoffs’. To put it in another way, the aim is to be able to manage both conditional branches:
Source Image: Google
For this, it will be turned to an if-else statement by adding an else statement. An if-else statement instructs the program to run a code block when the conditional statement evaluates to ‘True’ in R. Similarly, a different code block runs when the conditional statement evaluates to ‘False’. Given below is an image in the form of a flowchart and with respect to R syntax of how it works.
Source Image: Google
Three arguments are required by the if-else in R:
A statement that either evaluates to False or True.
In case the comparison operator executes to ‘True’, the value that should be returned by R.
In case the comparison operator accesses to ‘False’, the value that should be returned by R.
Hence, a code block has to be added that will run when team_A > team_B, the conditional expression, returns ‘False’. With the addition of an else statement in R, this can be done. In case the comparison operator computes to ‘False’, then “Team B will make the playoffs” is printed.
Source Image: Google
If you are curious to learn about tableau, data science, check out IIIT-B & upGrad’s Executive PG Programme in Data Science which is created for working professionals and offers 10+ case studies & projects, practical hands-on workshops, mentorship with industry experts, 1-on-1 with industry mentors, 400+ hours of learning and job assistance with top firms.


![Top 13 Highest Paying Data Science Jobs in India [A Complete Report]](/__khugblog-next/image/?url=https%3A%2F%2Fd14b9ctw0m6fid.cloudfront.net%2Fugblog%2Fwp-content%2Fuploads%2F2020%2F08%2F904-scaled.jpg&w=3840&q=75)
![Most Common PySpark Interview Questions & Answers [For Freshers & Experienced]](/__khugblog-next/image/?url=https%3A%2F%2Fd14b9ctw0m6fid.cloudfront.net%2Fugblog%2Fwp-content%2Fuploads%2F2020%2F09%2F991.png&w=3840&q=75)


![Inheritance in Python | Python Inheritance [With Example]](/__khugblog-next/image/?url=https%3A%2F%2Fd14b9ctw0m6fid.cloudfront.net%2Fugblog%2Fwp-content%2Fuploads%2F2020%2F12%2F1434.png&w=3840&q=75)


![Sorting in Data Structure: Categories & Types [With Examples]](/__khugblog-next/image/?url=https%3A%2F%2Fd14b9ctw0m6fid.cloudfront.net%2Fugblog%2Fwp-content%2Fuploads%2F2020%2F05%2F493-Sorting-in-Data-Structure.png&w=3840&q=75)

